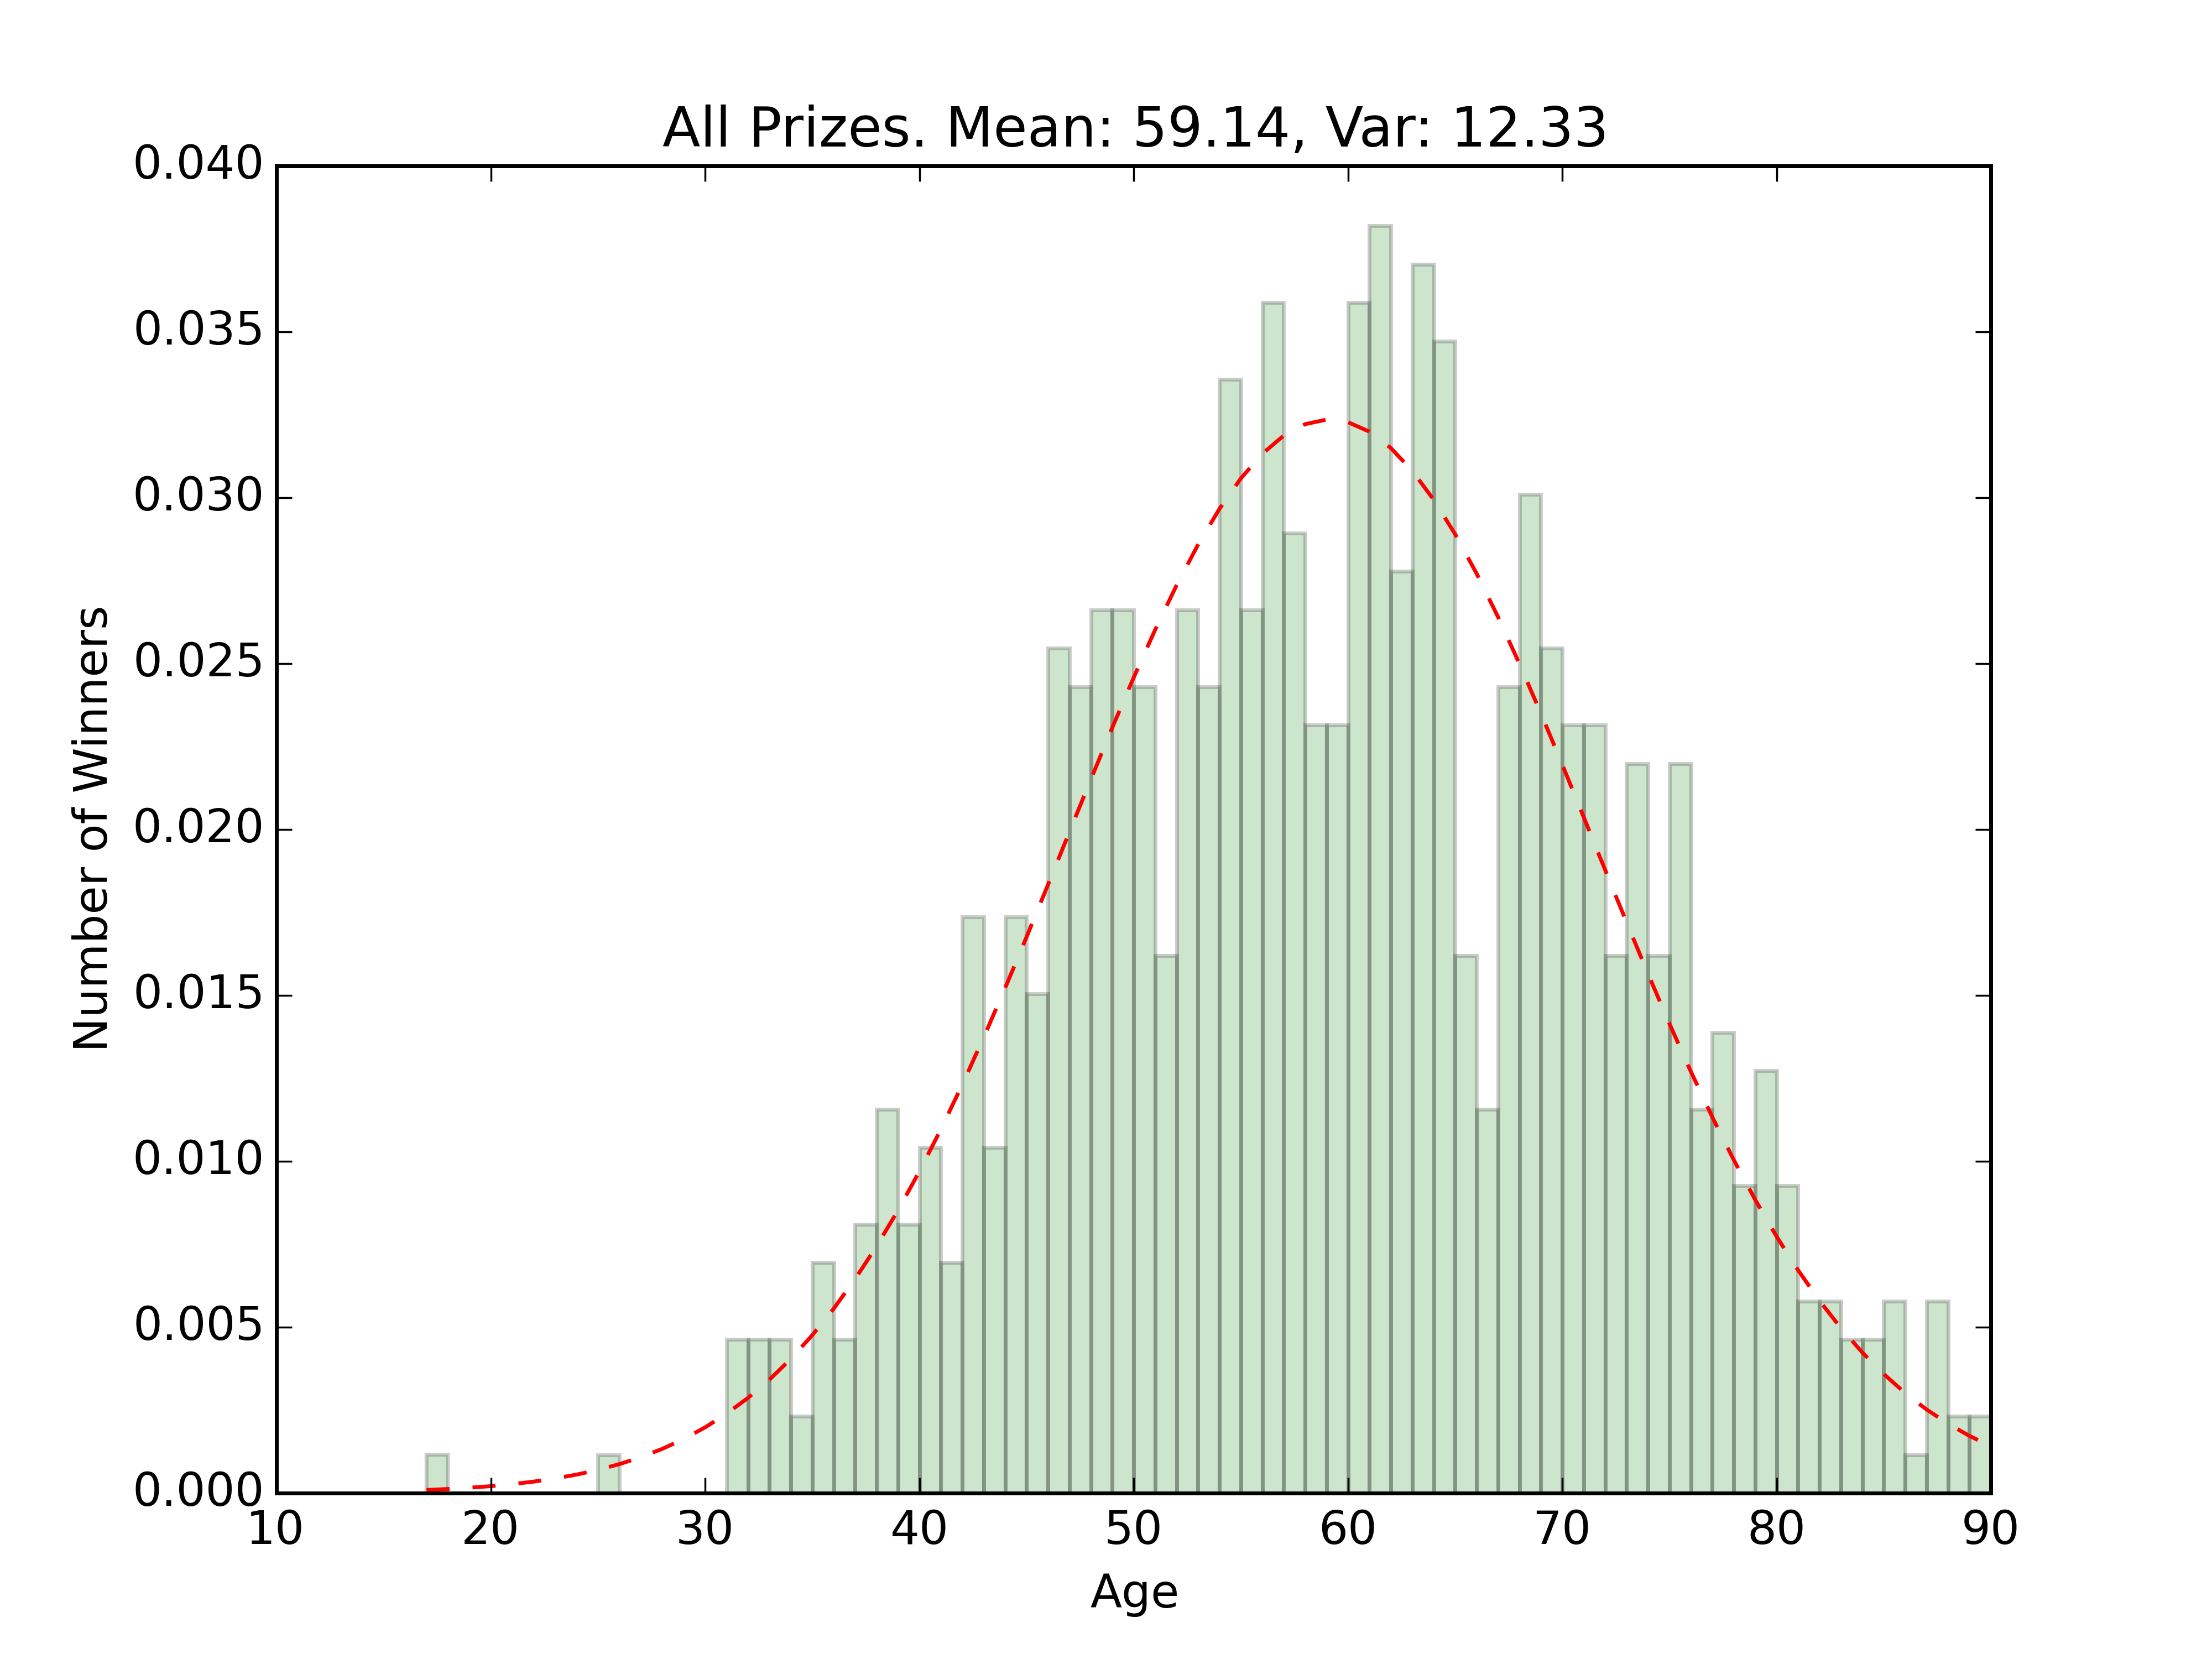
tl;dr — Average age of a Noble Prize winner is 59.14 years old.
There was a comment on HN the other day about wondering about the average age of Nobel Prize winners. I did a quick search for lists of Nobel Prize winners, and the Nobel Prize org’s website actually has a page listing winners and their ages. The data’s tucked in the html file, but I figured with scraping and a little numerical work, I could do a little analysis easily.
The first thing I did was download that html file, and store it locally. Sure I’m scraping data from an html file, but there’s no reason for me to hit the server every time I’m testing / adjusting my script. It’s important to realize that even though I’m dealing with a web page, I don’t have to actually use the internet to do the analysis. Downloading the page simplifies things on my end by not having to use the requests library, and also saves a few server hits on the other end.
The other thing it allows me to do is modify the html and put an id on a div tag which helps me locate the data I want. After look through, the div that contained all the data about the winners and their ages didn’t have a class, id, or anything else identifiable. It was literally just a div tag, and when you’re trying to automate data collection from a DOM, classes and ids are key. But since I downloaded the page, I was able to put an id on the div I needed to grab, and didn’t have to deal around with maneuvering to it using parent tags.
The relevant info for each of the winners was structured pretty well within that div. In order to organize the information, I created a class for each of the prize winners, and input the data by looping through the html.
class Prize:
 def __init__(self, name, age, year, prize_type):
 self.name = unicodedata.normalize('NFKD', name).encode('ascii','ignore') #umlaut issues
 self.age = age
 self.year = year
 self.prize_type = prize_type

 def __str__(self):
   return self.name + ' won ' + str(self.prize_type) + ' at age ' + str(self.age) + ' in ' + str(self.year)

f = open('nobel_laureates_by_age.html', 'r')
html = BeautifulSoup(f.read())

winners = []
prize_types = set()
nobel_prize_string = "The Nobel Prize in "
for tag in html.find("div", id="nobel-age-info").children:
  # we're looking for a specific div, that doesn't have a class, id, or anything noteworthy
  #so I'm going to count the divs that are in this outerdiv until we hit the one I want
  if tag.name == None:
    next
  elif tag.name == 'h3':
    current_age = int(tag.text.split(" ")[-1]) #update the age
  elif tag.name == 'div':
    name = tag.find("h6").text #winner's name
    description = tag.find_all("p")[0].find("a").text #winner's name
    year = int(description.split(' ')[-1])
    prize_type = ' '.join(description.split(' ')[0:-1])
    prize_types.add(prize_type)
    prize = Prize(name, current_age, int(year), prize_type, description)
    winners.append(prize)
From here, we want to get an average and a visualization of the ages of the winners for each prize.
all_prize_string = "All Prizes"
ts = list(prize_types)
ts.append(all_prize_string) #want to get all prizes too

print "Type, Number of Winners, Mean Age, Variance of Ages"
for prize_type in ts:
  ages = [p.age for p in winners if p.prize_type == prize_type or prize_type == all_prize_string]
  num_bins = ages[-1] - ages[0]
  fig = plt.figure()
  n, bins, patches = plt.hist(ages, num_bins, normed=1, facecolor='green', alpha=0.2)
  mean, var = norm.fit(ages)
  y = mlab.normpdf(bins, mean, var)
  plt.plot(bins, y, 'r--')
  plt.ylabel('Number of Winners')
  plt.xlabel('Age')
  plt.title(prize_type + '. Mean: ' + str(round(mean,2)) + ', Var: ' + str(round(var,2)))
  fig.savefig('nobel_hist_' + prize_type.lower().replace(' ', '_') + '.png', dpi=500,format='png')
  print prize_type +', '+ str(len(ages)) +', '+ str(round(mean,2)) +', '+ str(round(var,2))
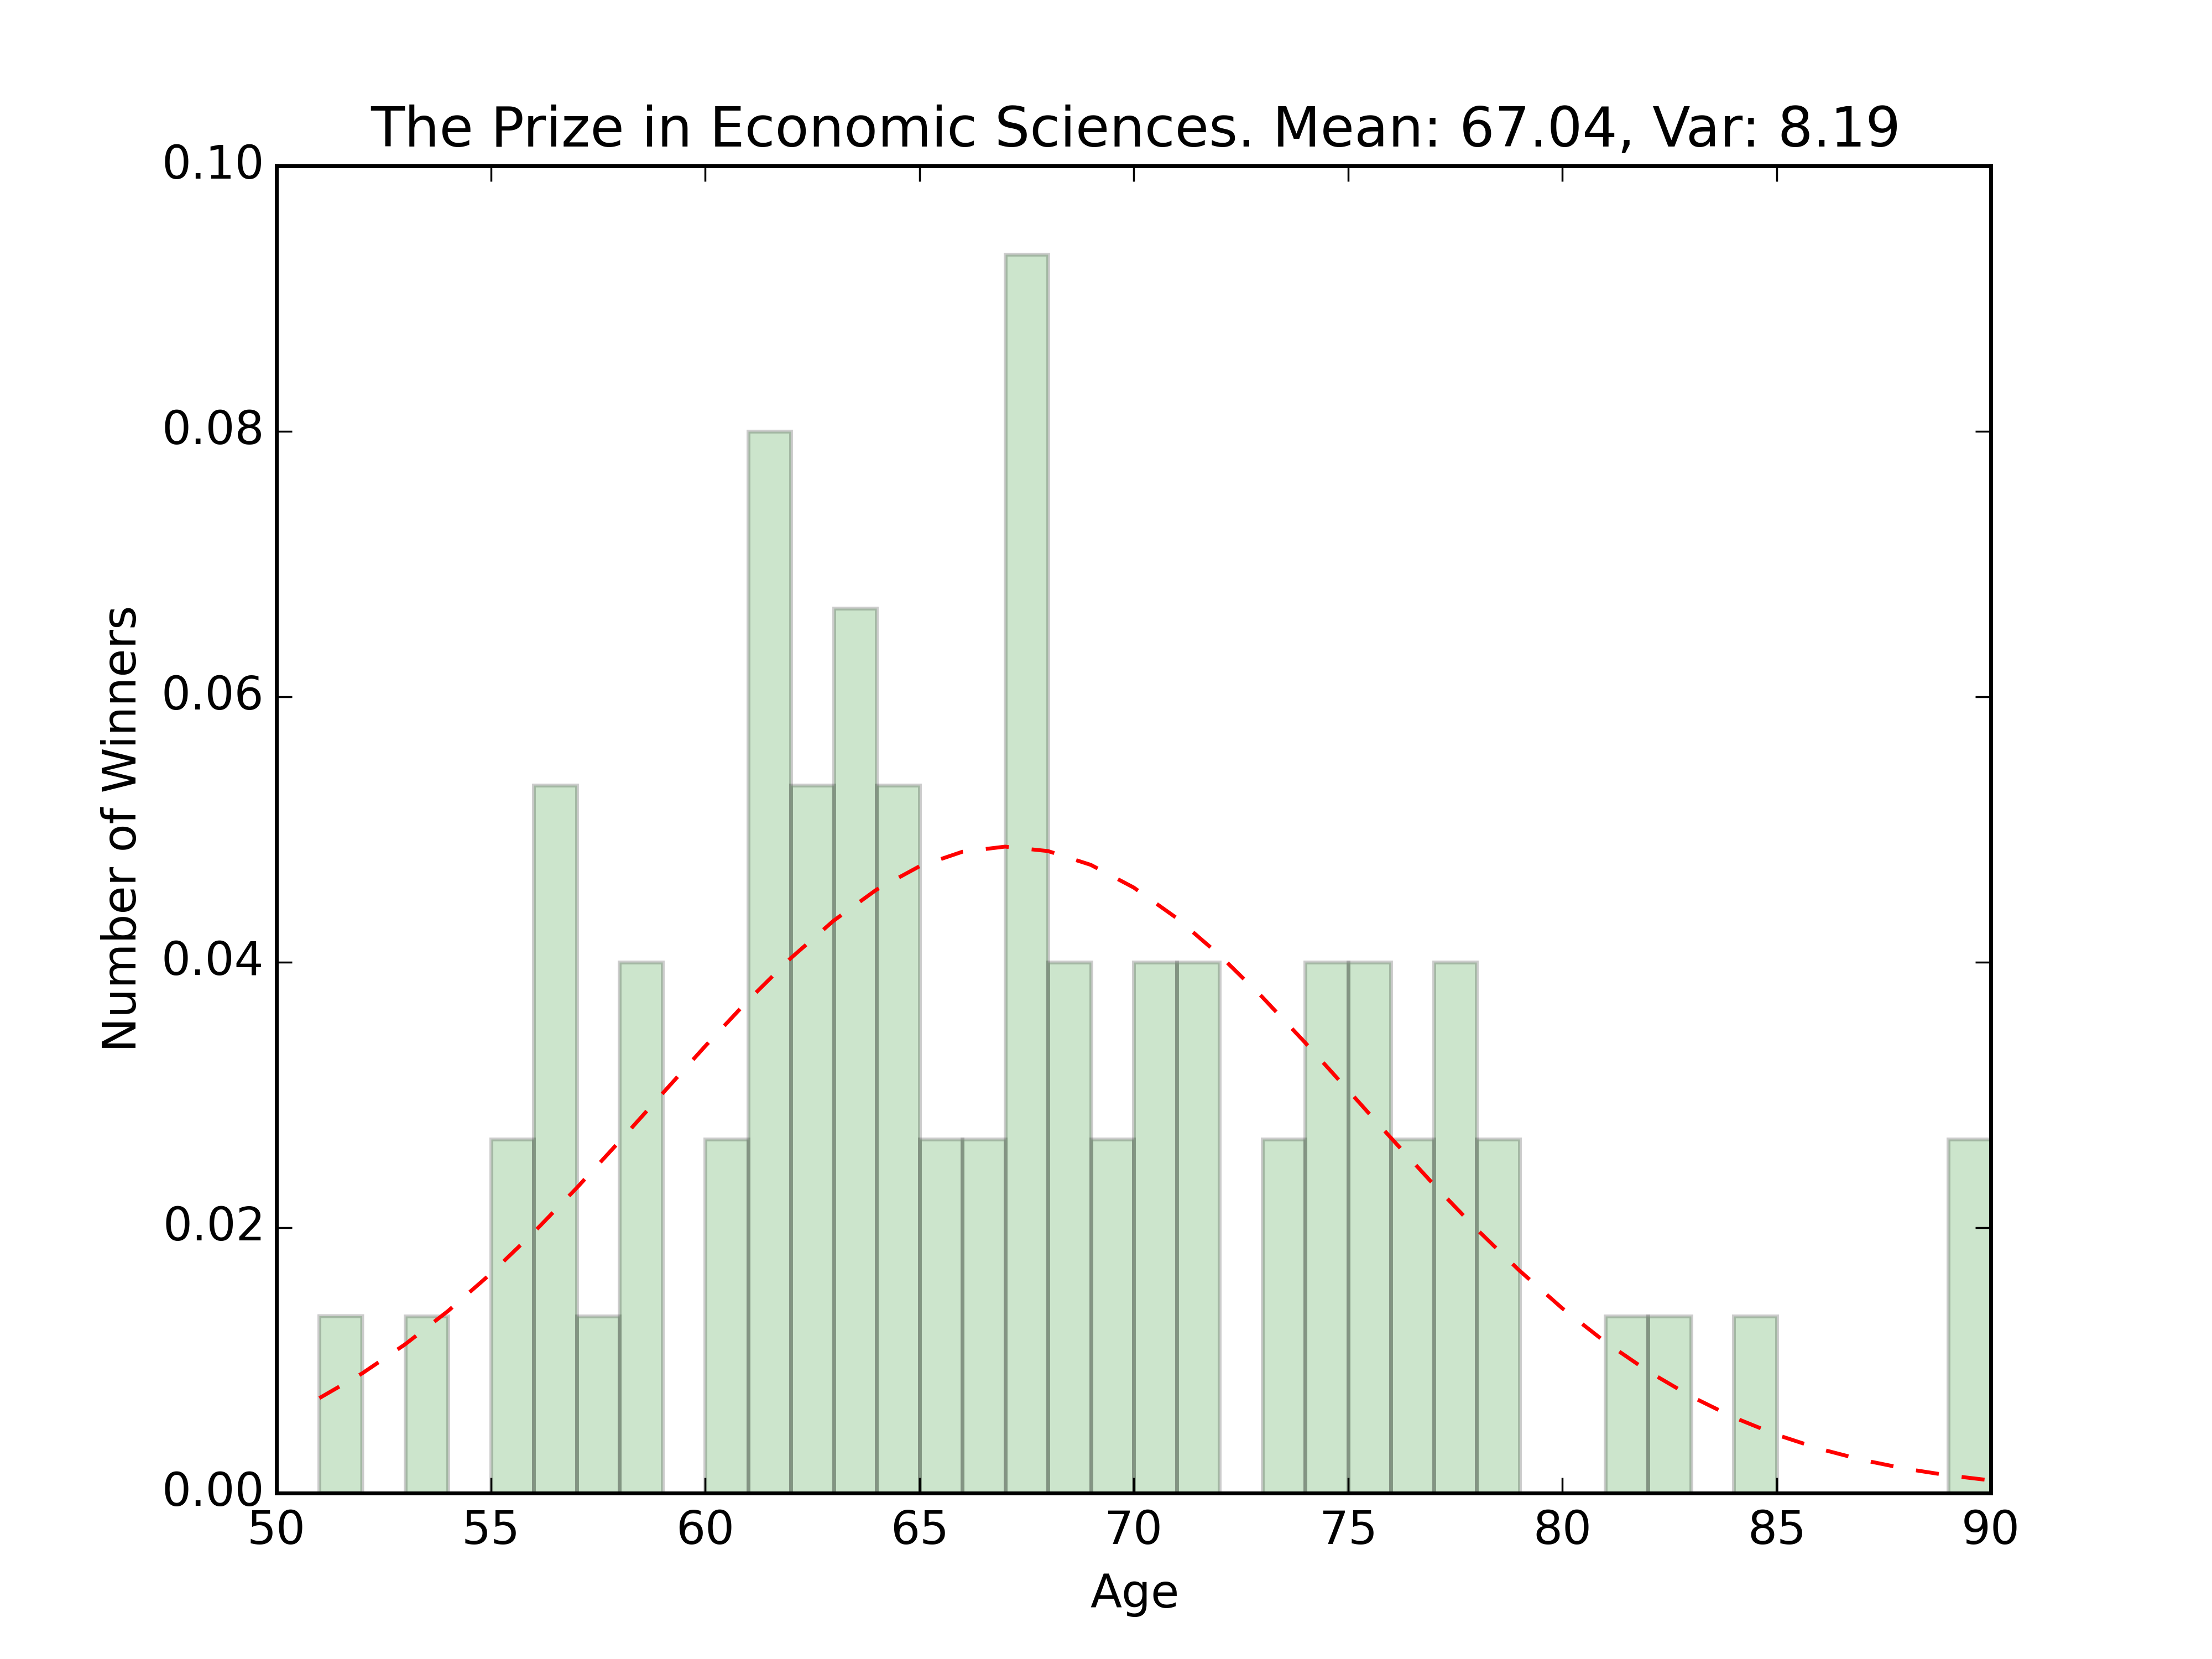
The code above print out a little csv table for each of the prize types, as well as creating a histogram and fitted distribution for each, as well as the ages for everyone, regardless of prize type.
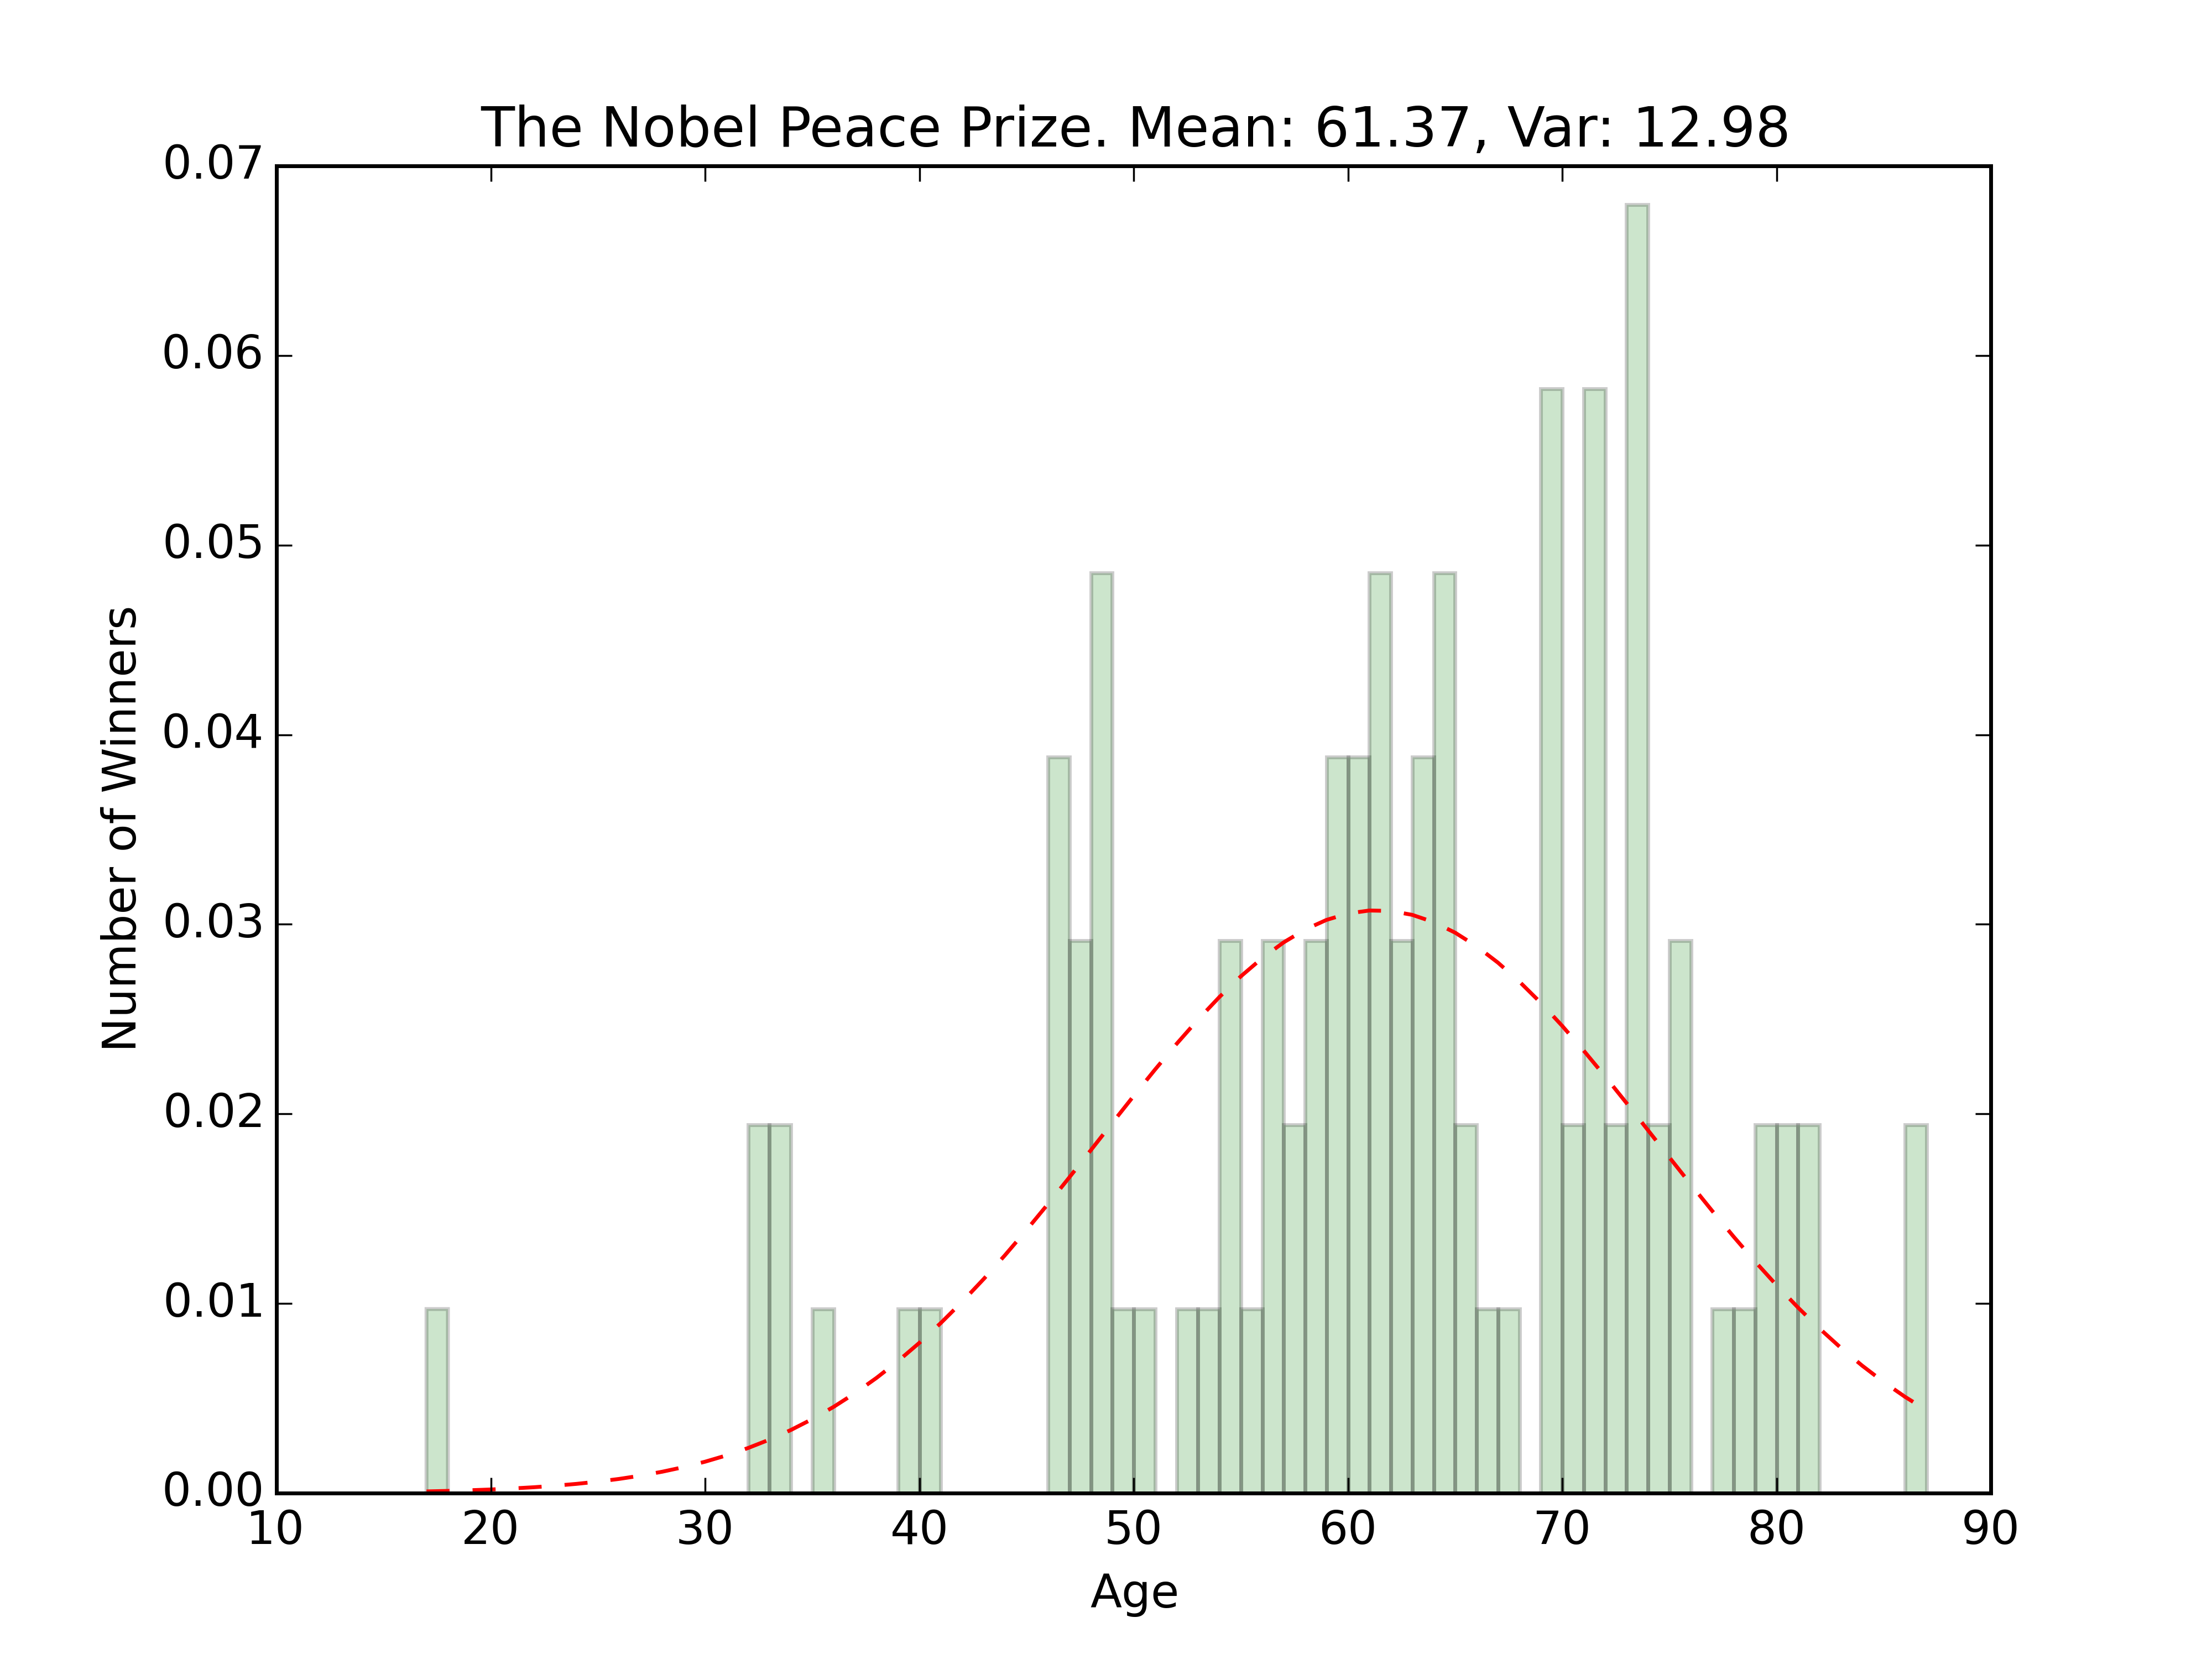
Somewhat grainy images of the fits are below


Some Thoughts
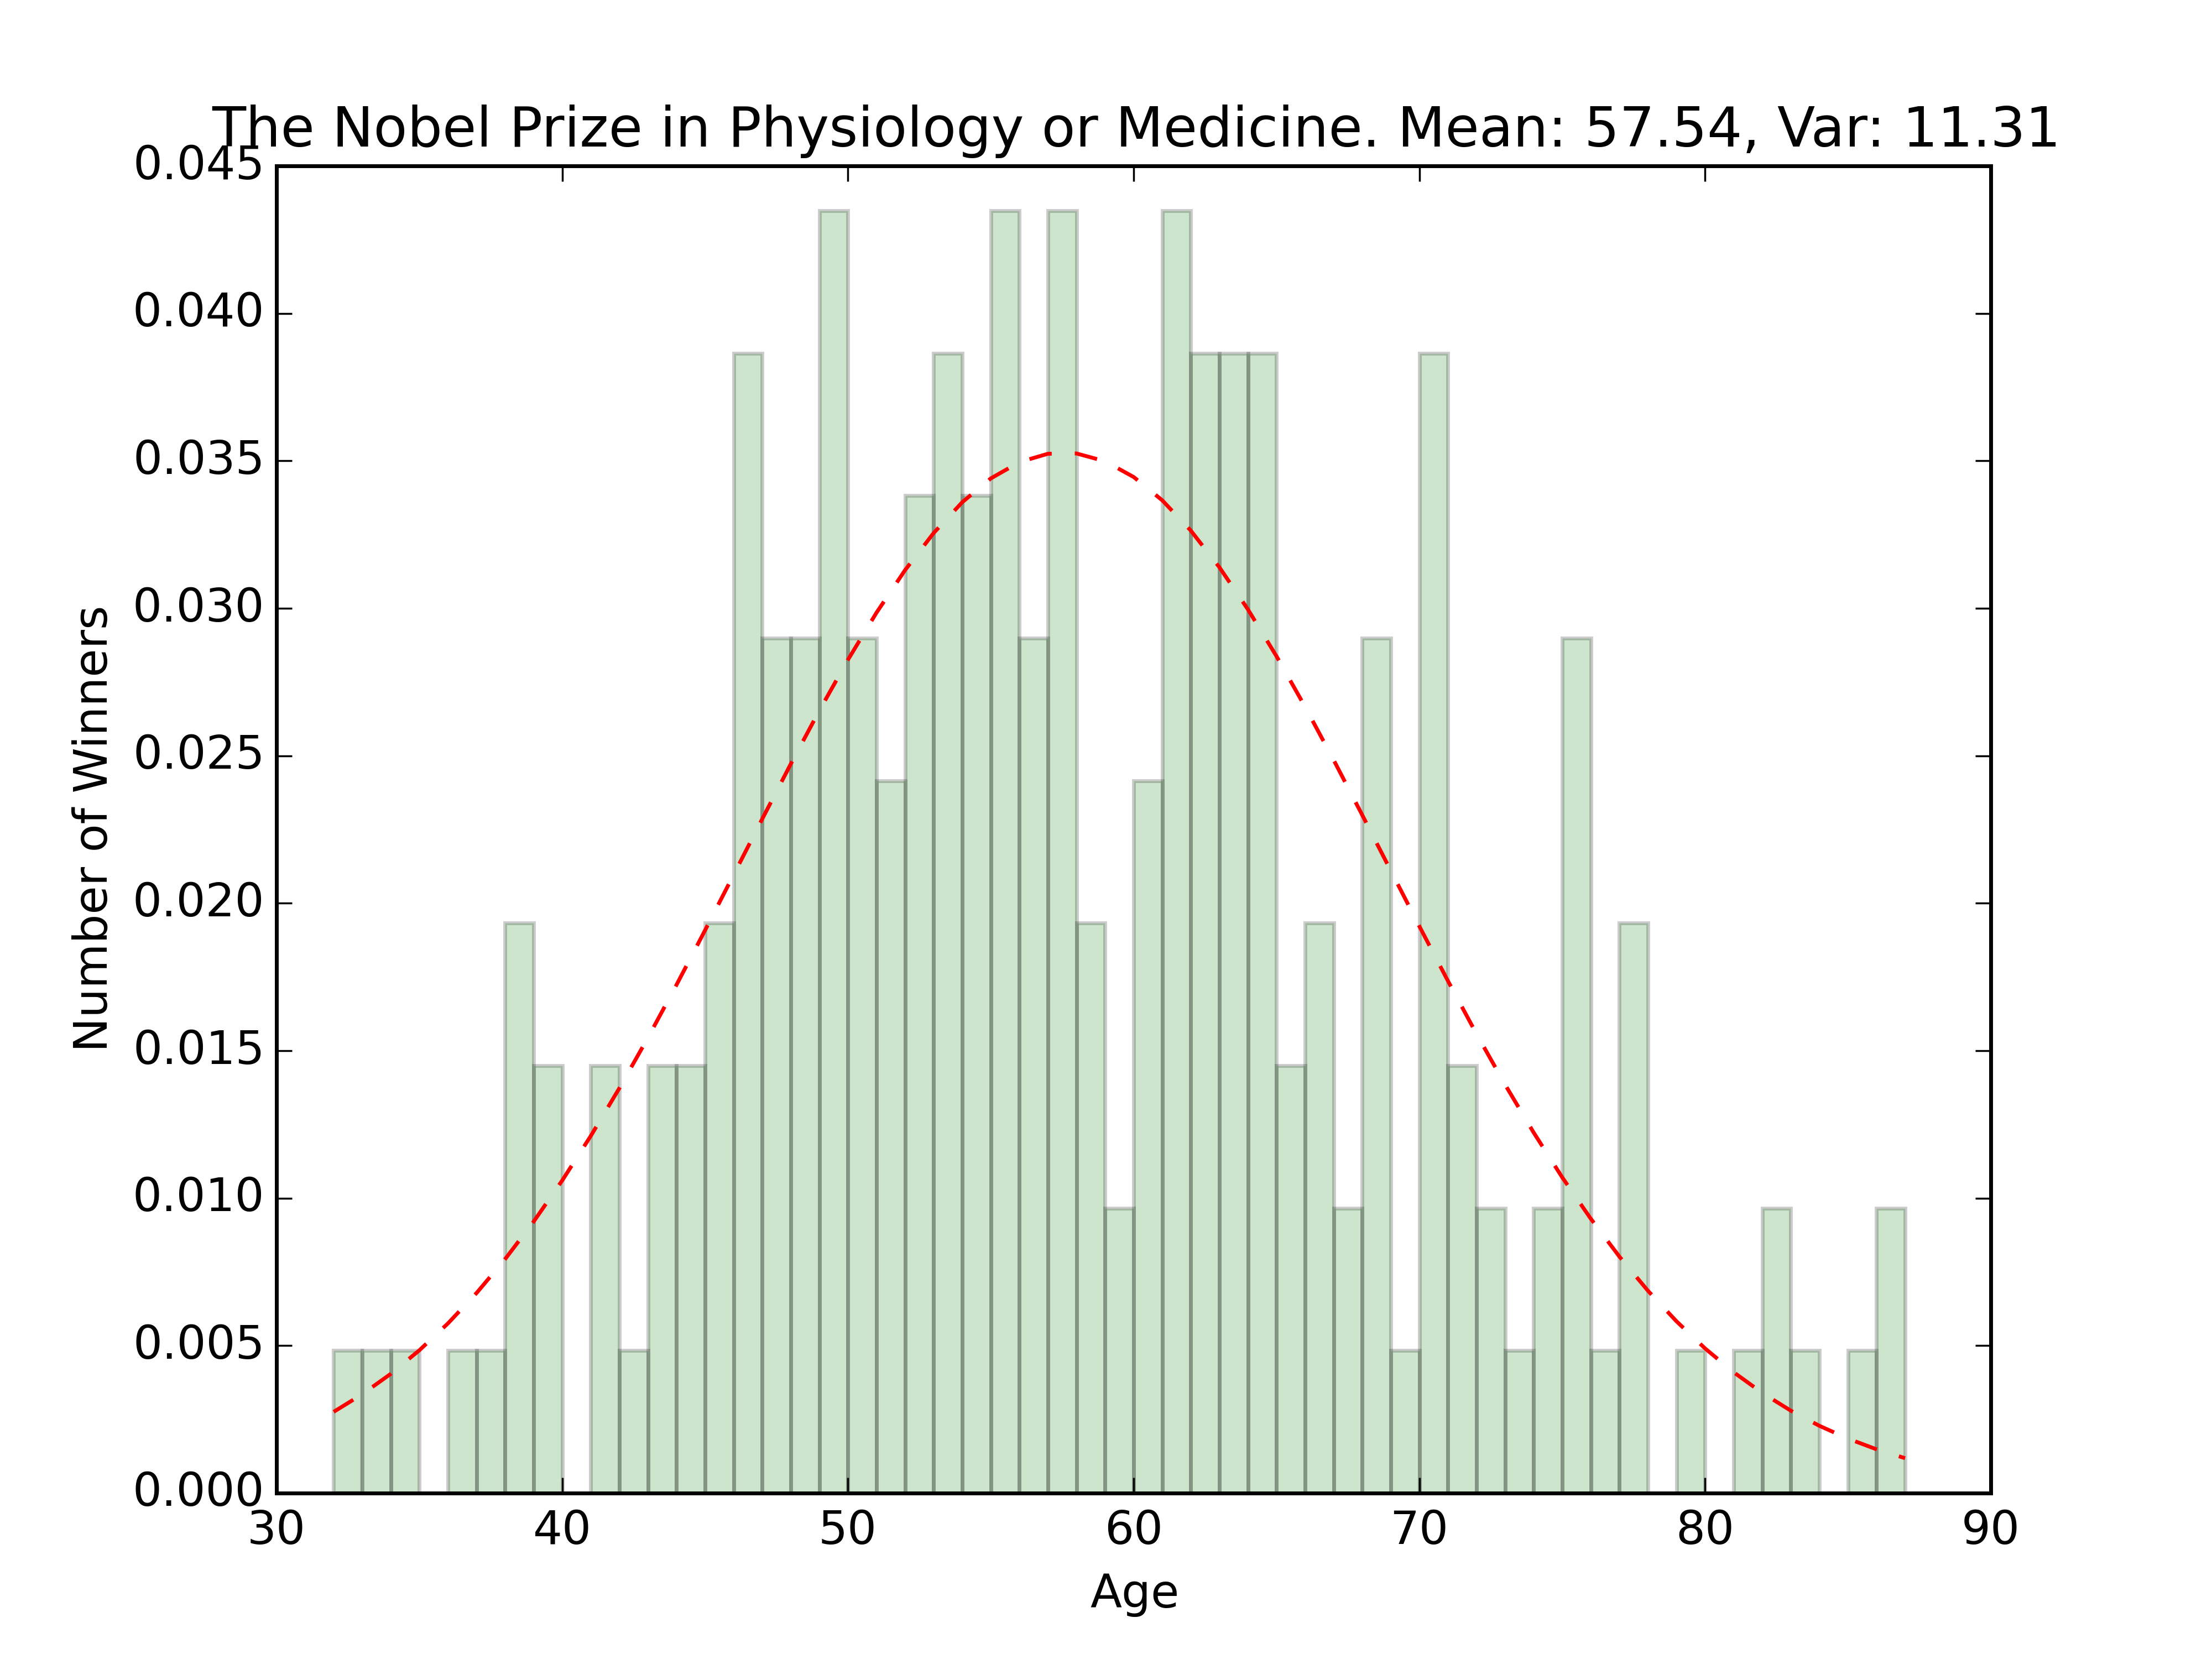
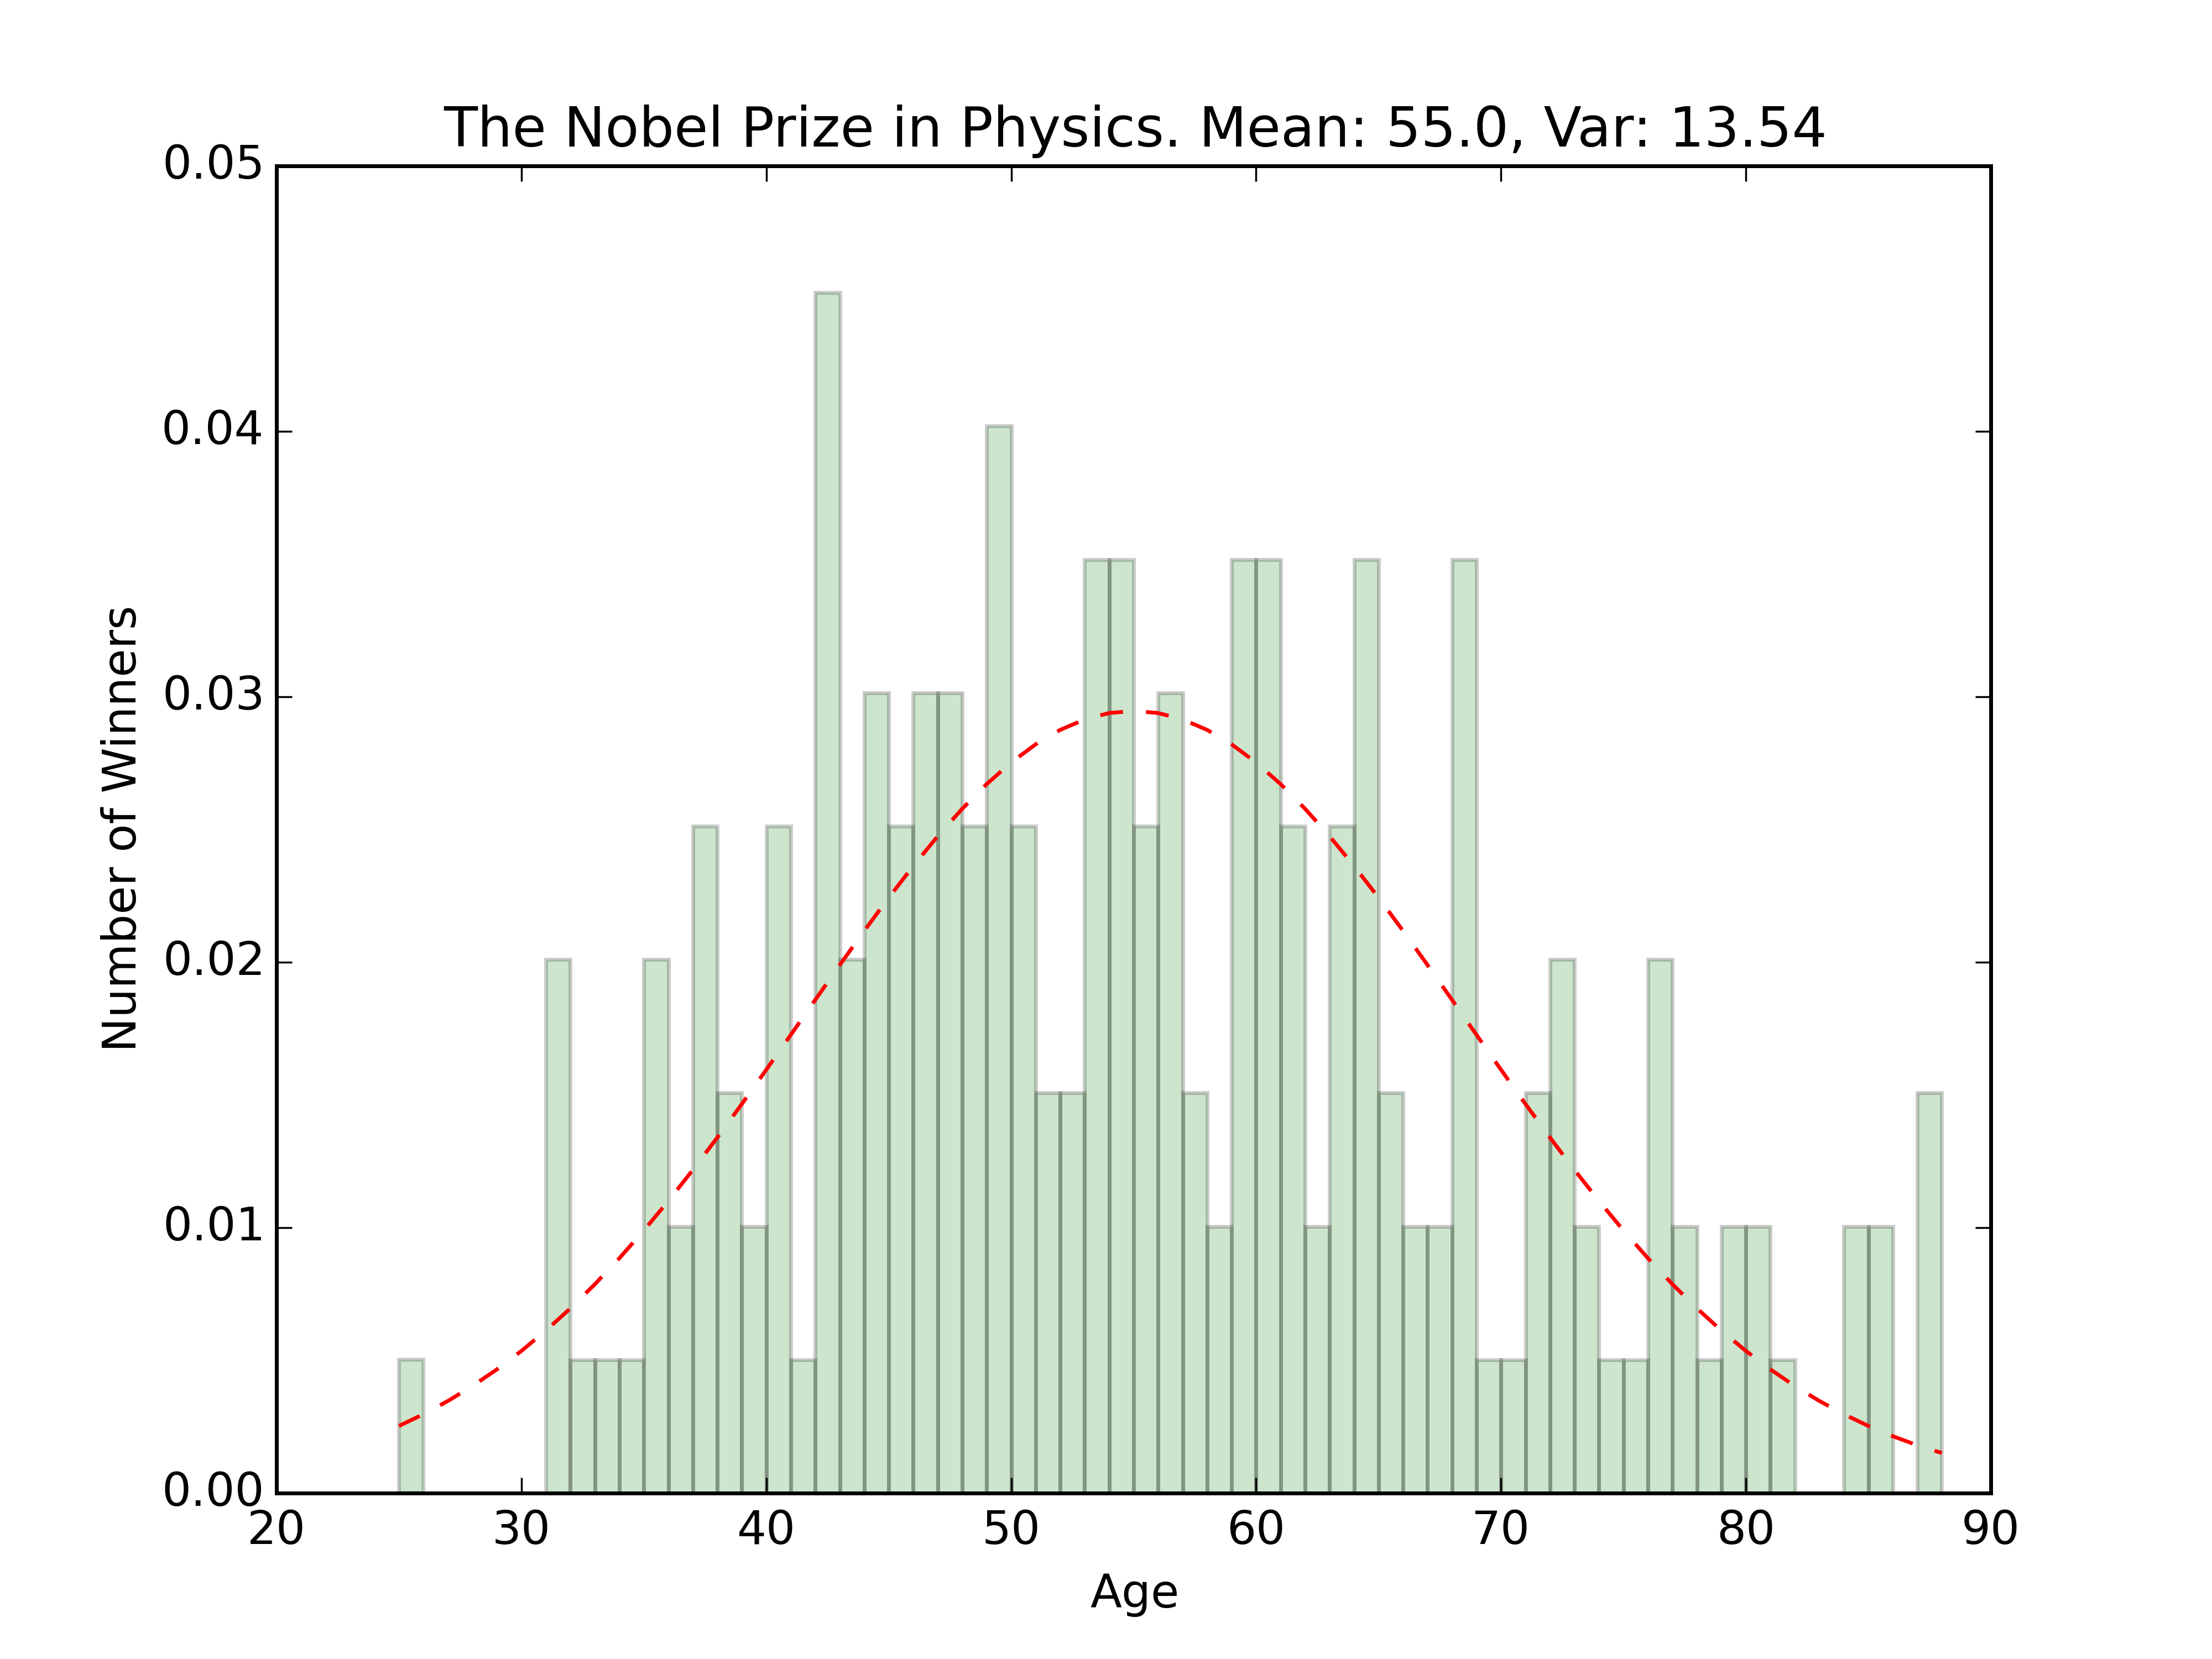
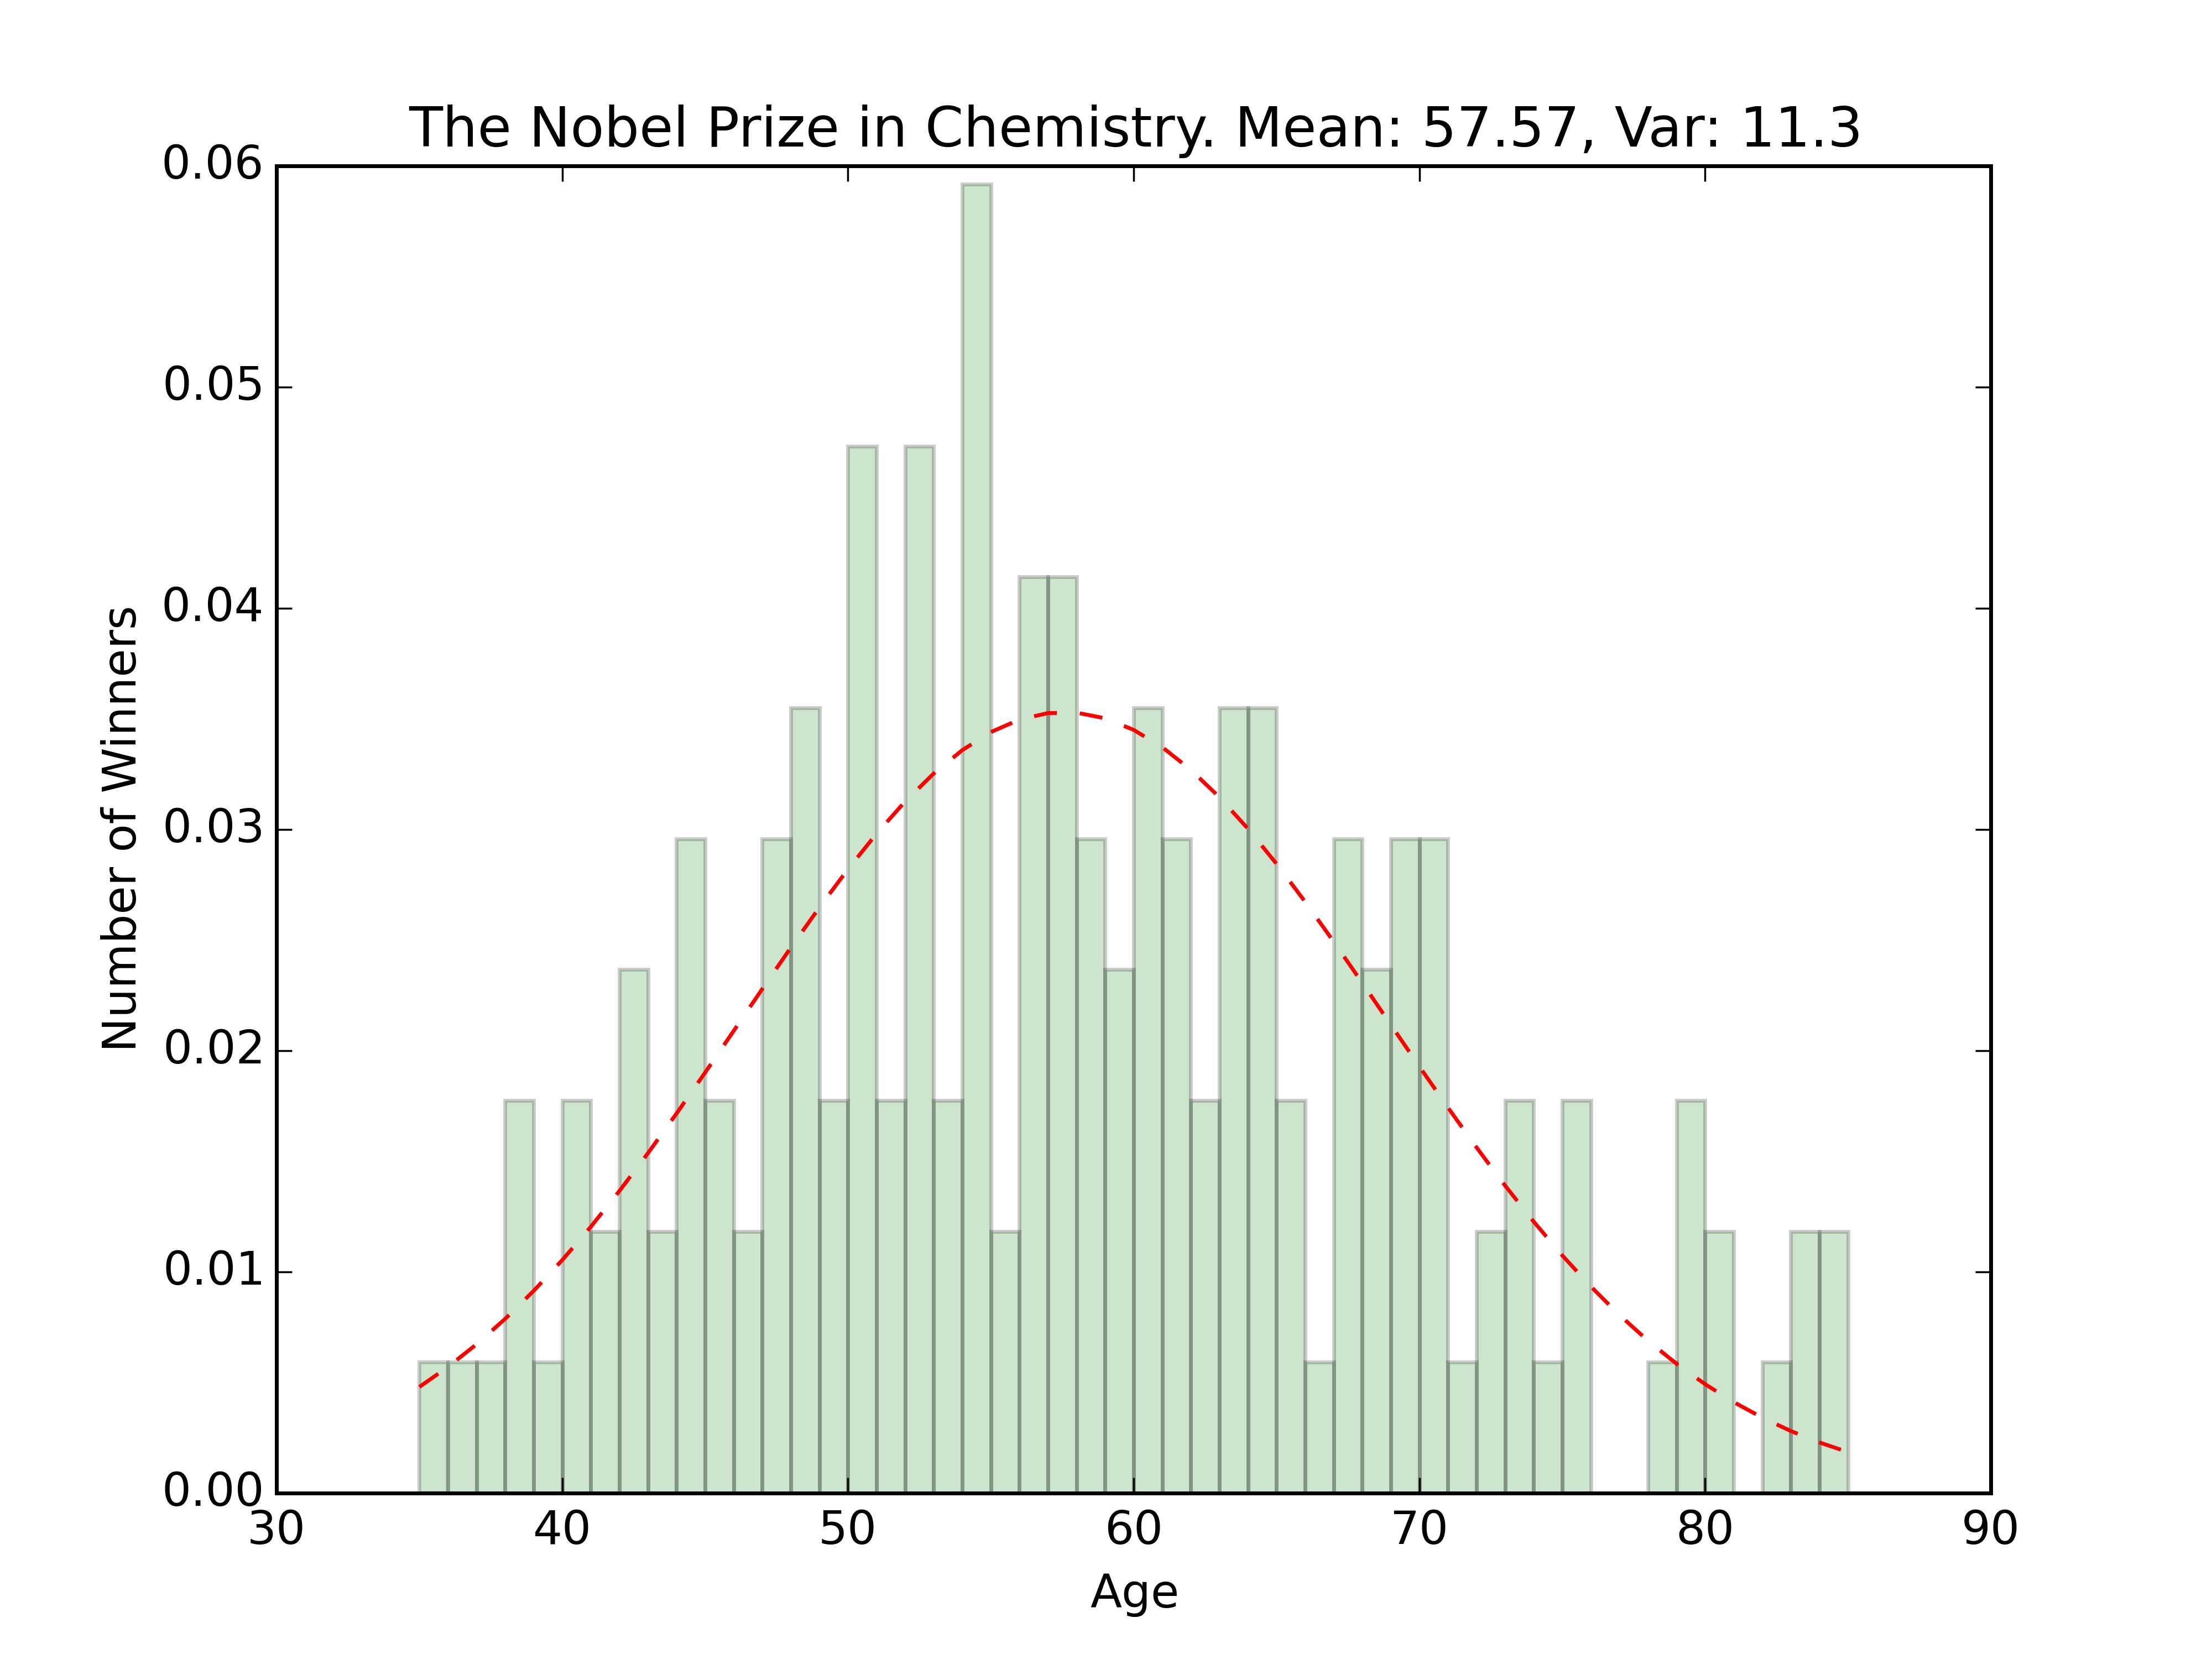
The overall age distribution is impressively normal. The couple outliers on the younger side are the 2014 Peace Prize winner Malala Yousafzai, and the 1915 Physics winner William Lawrence Bragg who won jointly with his father for work with X-Rays. Besides those winners, the rest seem pretty centered around the 60 year old mark.
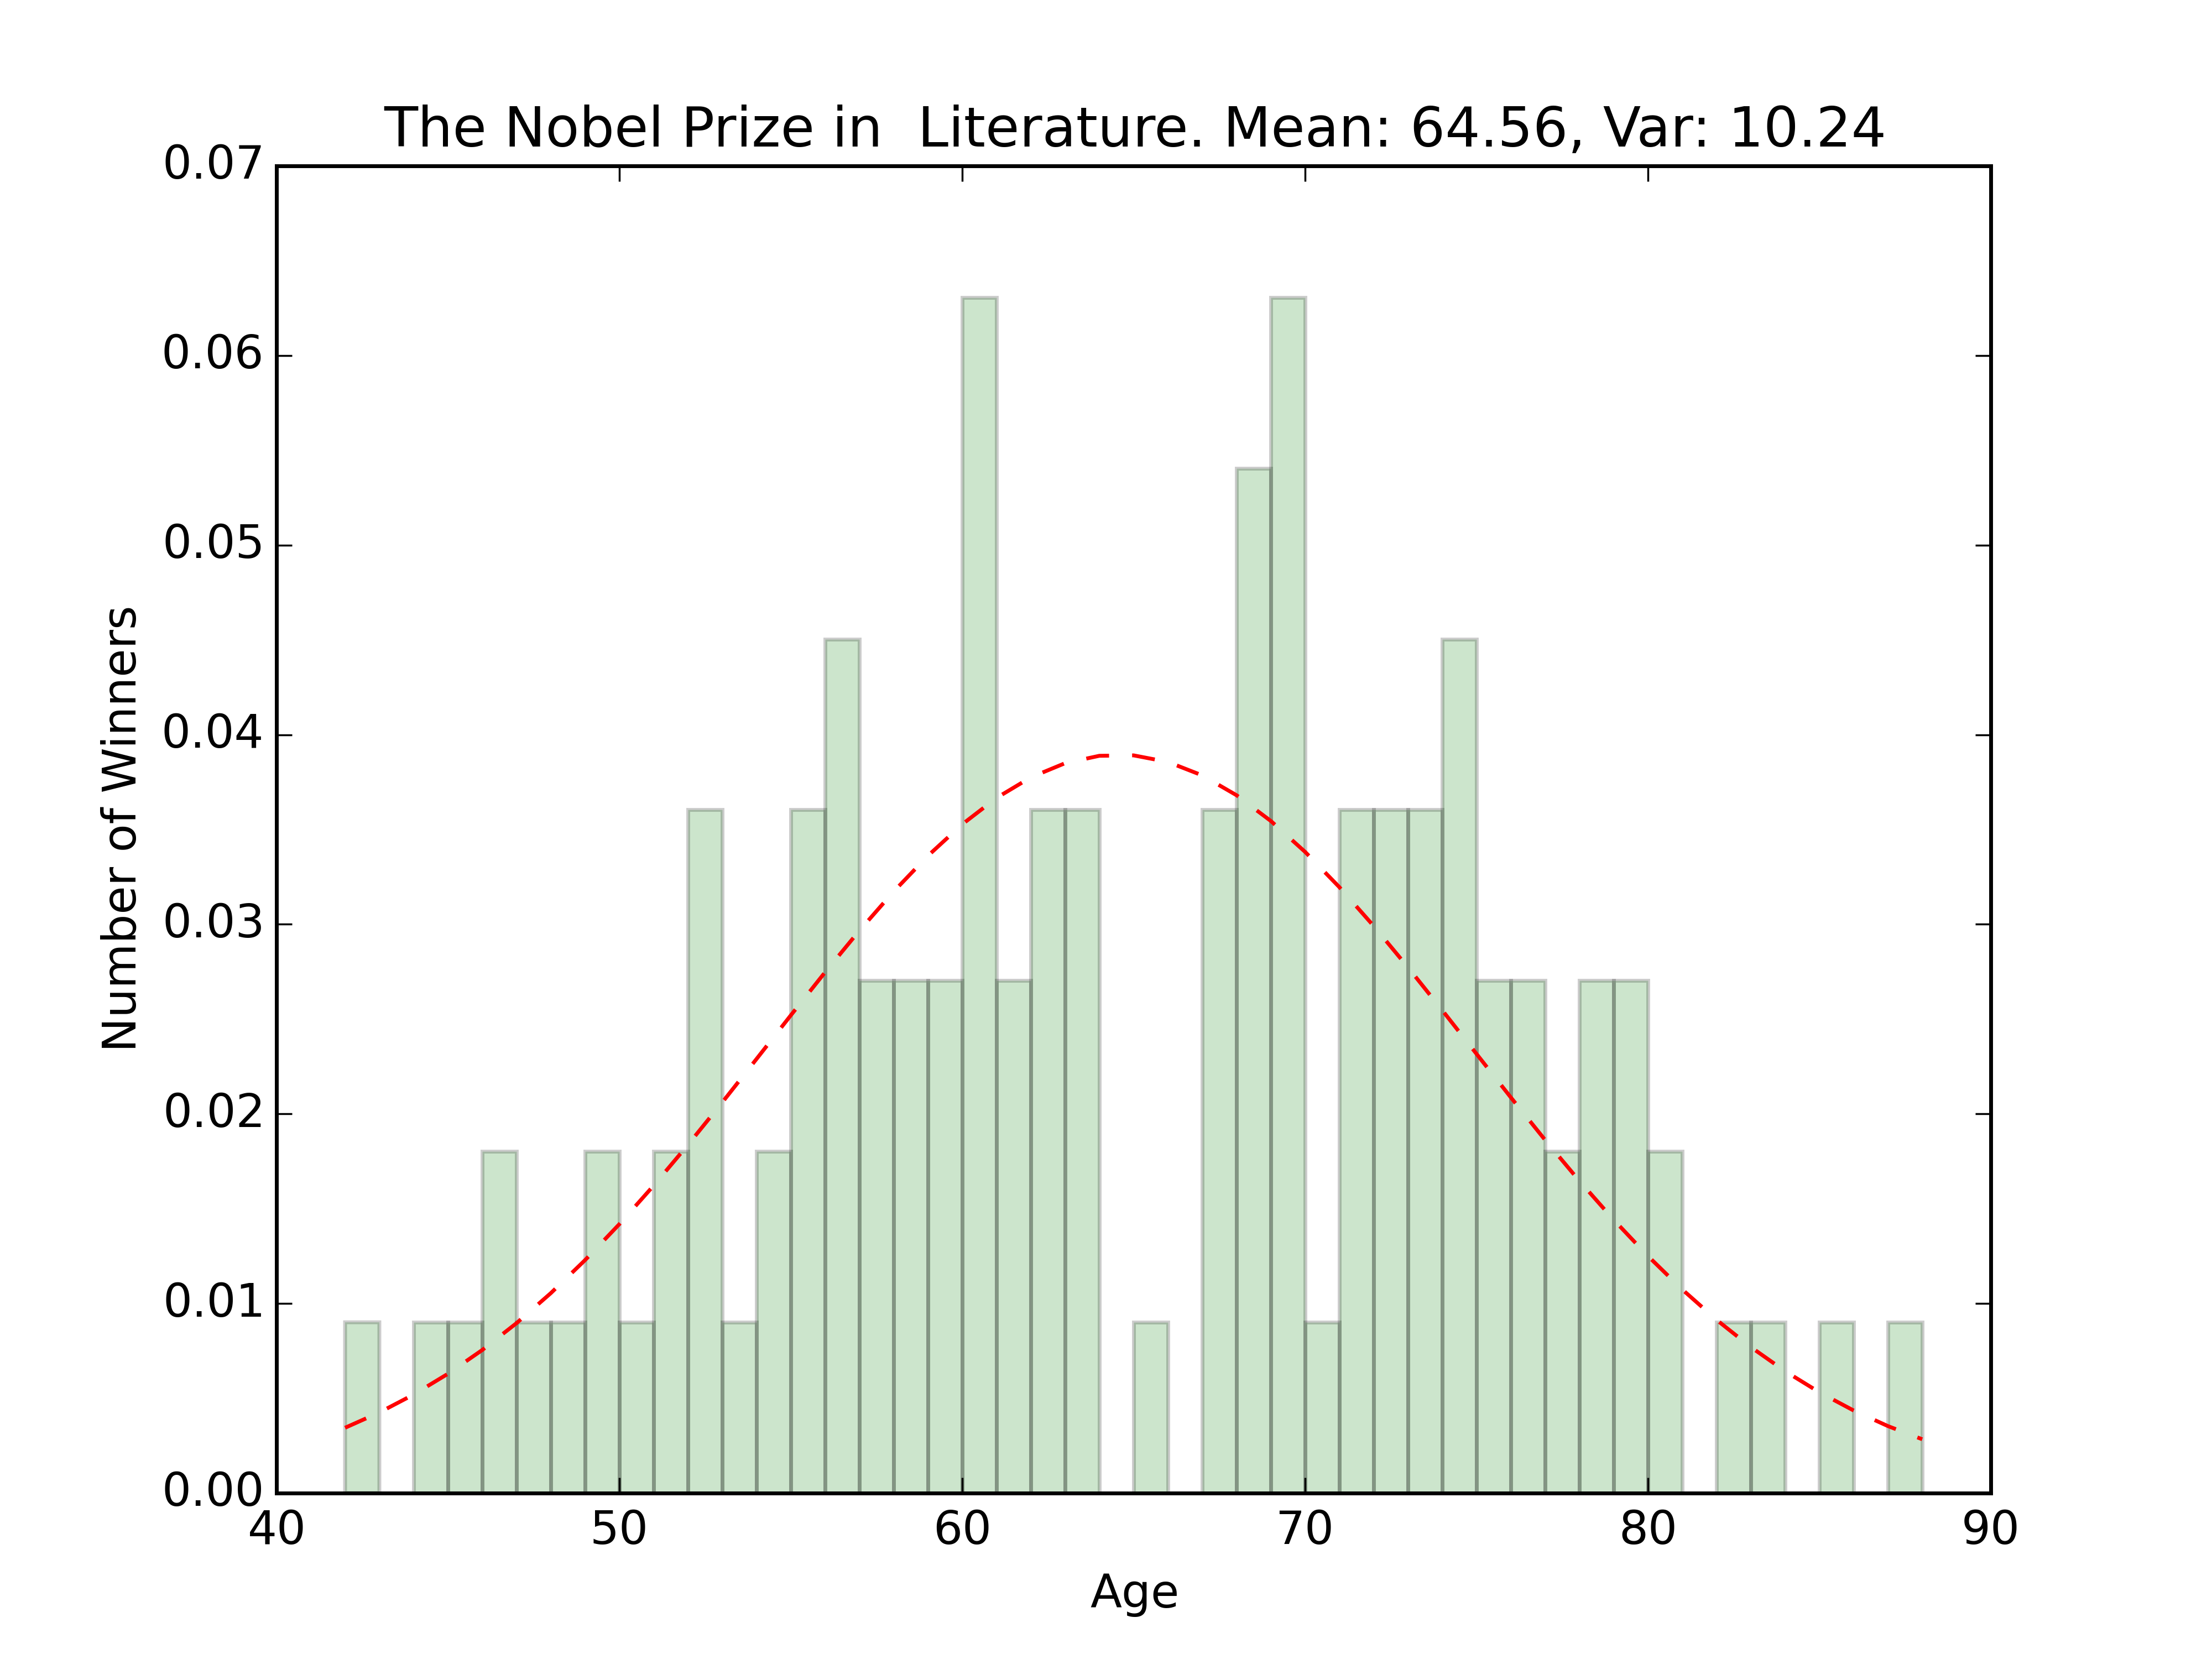
There’s a funny dip in the graph for the prize on literature right around the mean. Only one winner with an age of 64-66. Funny because the mean for that award is about 65.
Youngest winners for each:
Chemistry: 35
Literature: 42
Peace: 17
Physiology or Medicine: 32
Economics: 51
Oldest Winners for Each
Chemistry: 85
Literature: 88
Peace: 87
Physiology or Medicine: 87
Economics: 90
Physics: 88
Oldest winners seem to be around the same age, while the younger winners seem to differ by prize type. Kind of interesting, given that the prize for Economics wasn’t started by Nobel in 1895 like the others, but rather in 1969. (Check out the wikipedia entry here.) The fewer number of winners could explain the youngest winner outlier. Once the award has been around for longer, you’d expect someone younger than 51 to win. Using the distributions, we can actually guess the probability that someone younger than 51 will win: about 2.5%.
Another explanation that I’ve heard before is that sometimes prizes are won for contributions over time. They want to recognize a person for their contributions over their careers, but not necessarily their research in their winning year. That could easily push the average age up. Obviously the Nobel Foundation would refute that, but who knows.
Possible Continuations
NLP on the descriptions — Most of the winner’s have a little sentence below that talks about what they did to deserve the prize. Some processing on that text might be interesting, like seeing what the popular keywords are for example.
Deal with multiple people sharing the prize — The reason there are over 800 winners of the 6 prizes is because people share the prize. The links on the page go to a more full description of the prize winner(s). For shared prizes, I might want to take the average age for the winners and only use that. I could also do an analysis on how often the prize is shared as opposed to won outright. Maybe the percentage of shared awards have changed over time?
Check out the gist here. Requires that you download the html like and add the id to the tag like mentioned above. And also have the required libraries installed with pip.
Comments? Want further analysis? Want to yell at me for bad analysis? Let me know on twitter.