Guest Post – Learning R as an MBA Student

Hello!

If I’d wanted to really grab your attention, I should have title this article something like 13 Tips that Could Save You Years of Effort or A Guide to Becoming a Full Stack Developer in 2017. But I don’t know how to save you years of effort and I can’t write a comprehensive guide and, frankly, I am not interested in pretending like I do! So instead, you get a boring but honest title, and my thoughts as someone who is not an expert and who is not planning to make a career out of programming.

I’m Sara, Jack’s older sister, and I have the privilege of writing a guest post today! My background is not in anything related to programming – I am a CPA and spent over five years working as a public accountant, mostly in corporate tax.

So how does my background give me any right to be posting on this blog? I am now an MBA student and as part of my curriculum, I took a Business Statistics class which involved learning how to use R. I am not sure I can even say I had heard of R before taking this class, so there was steep learning curve for me.

I spent a lot of time thinking about what I could actually write in this post that might be useful to Jack’s readers, since you could all out-program me in your sleep. My first draft of this post involved a lot of specifics regarding the questions I was assigned and how I solved them, but that didn’t seem helpful to anyone. Plus, although I did well on my assignment, I’m not totally sure what I did right versus what I did wrong.

Instead, I’ve decided to share a few of the insights I gleaned from my brief experience as a programmer, and also some of the resources I used to teach myself as I completed my assignments. I’d like to note that just like I’m new to programming, I’m new to writing about programming, so I assume this post will be unlike most others on the subject.

If you’re like me and you are new to programming, hopefully this will help you get started. If I learned one thing, you can’t just be taught how to do this, but maybe this will give you some inspiration.

Play around, but make sure you have an idea / project in mind

Considering I’m such a rookie, the first thing I needed to learn how to do wasn’t writing code, but installing R.

https://www.youtube.com/watch?v=A56PD8BSS0A

We then spent an entire class session following along as our professor demonstrated the very basics of R. This proved to be invaluable – I wouldn’t have even felt comfortable knowing where to even begin otherwise.

I think it’s important to note that although we were just playing with various functions, we were doing that in relation to one of the problems we’d been assigned. With his guidance, we were able to see how we should begin to work the problem, and how various functions could help meet our goal. It seemed to me that learning various functions through experimentation is useful, but you’ve got to make sure you’re working towards a goal as you do so.

The example we went over in class involved determining whether a specific pitcher for the Oakland As influenced the team’s ticket sales.

Following along with my professor, we named our data “As”, and then my very first lines into R looked like this:

> names(As)
[1] "TICKET" "OPP"    "POS"    "GB"     "DOW"    "TEMP"   "PREC"   "TOG"   
[9] "TV"     "PROMO"  "NOBEL"  "WKEND"  "OD"     "DH"    
> As(1,)
Error in As(1, ) : could not find function "As"
> As[1,]
  TICKET OPP POS GB DOW TEMP PREC TOG TV PROMO NOBEL WKEND OD DH
1  24415   2   5  1   4   57    0   2  0     0     0     0  1  0

As you can see, I made my first mistake right off the bat, using parentheses instead of brackets. After that first time, I don’t think I made that mistake again. Only through making the mistake and getting the error message did I figure out what I’d done wrong.

This proved to be the case time and time again as I made my way through the assignment, and I quickly learned mistakes are a way of life in programming. Somewhat infuriatingly, R returned just a blanket “error” message without much direction as to where I went wrong. I do think this helped me with my critical thinking, as it was up to me to figure out exactly where I had errored.

Bottom line: the time I spent tinkering around in R was when I learned the most. Figuring out how to correct errors was more instructive than getting it right the first time.

Time estimates are useless

In my career as a CPA, I could more or less predict how long various tasks would take. In fact, I usually had the previous year’s time reports to consult to see how much time we’d taken to complete the task in the past. I quickly found this is not the case with programming.

I sat down to work on my assignment on a beautiful summer Saturday, expecting it to take me a few hours maximum. By the time all was said and done, it took me probably ten hours to complete the three questions, spread over a few days. I talked to my classmates after we’d finished the assignment, and there was a wide array of time spend. People reported getting hung up on various parts, and there’s no telling how long it might take to work through the rough patches.

Maybe with more experience you get better at estimating how long projects take, but I have a strong hunch that you’ll often find you don’t know what you’re in for until you’re in the thick of it. I’m sure glad I started working on my assignment a week before it was due.

Don’t be embarrassed to google everything

If you’re having trouble with a specific function, chances are someone else out there has as well, and has asked the internet about it. Sometimes I didn’t even know what exactly it was that I was googling, but that generally didn’t matter as long as I hit the right keywords.

I often found myself reading helpful hints on various websites, and would cross-reference the notes I had from class. It quickly became clear to me that there’s no right way to do something. The way my professor showed an example in class was not how the people posting on Stackify perform the same task, and that’s ok. I actually think I learned more by seeing alternative ways of performing the same function.

I may be totally off base in saying this, but from all the googling I did, it seems to me that the exact lines of code one person uses to complete a project is as distinctive as their handwriting. I was not expecting programming to be such an individualized process.

I’m also not embarrassed to say that that’s how I solved a lot of my errors. This actually reminded me a lot of my accounting career. For many research projects, I often began by consulting google, and our firm definitely encouraged that.

Sleep on it

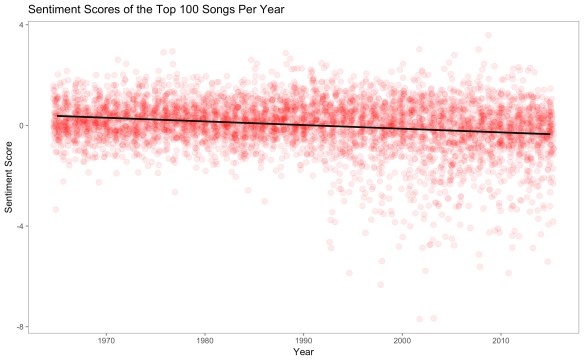
As I neared the end of my assignment, I got began to get very frustrated when something that I thought I’d mastered was not working out. I couldn’t figure out what I was doing wrong. I had more or less finished the question, and only had to insert a line of best fit into my scatter plot.

No matter what I did, that dang line would not appear.

As much as I wanted to finish the assignment that day, Jack wisely advised me that it would do no good to keep typing the same code, hoping that the line would magically generate. After a few minutes of doing exactly that, I concluded that he was correct. So… I went to sleep.

The next morning, I woke up and found my last few lines of code:

> plot(TICEKT,fit0$residual+fit0$fitted.values,pch=20)

Error in plot(TICEKT, fit0$residual + fit0$fitted.values, pch = 20)

Can you spot my error? Yep, “TICEKT” is not a word. (Is now a good time to note that I was also an English major?)

I corrected my error and produced this beautiful result:

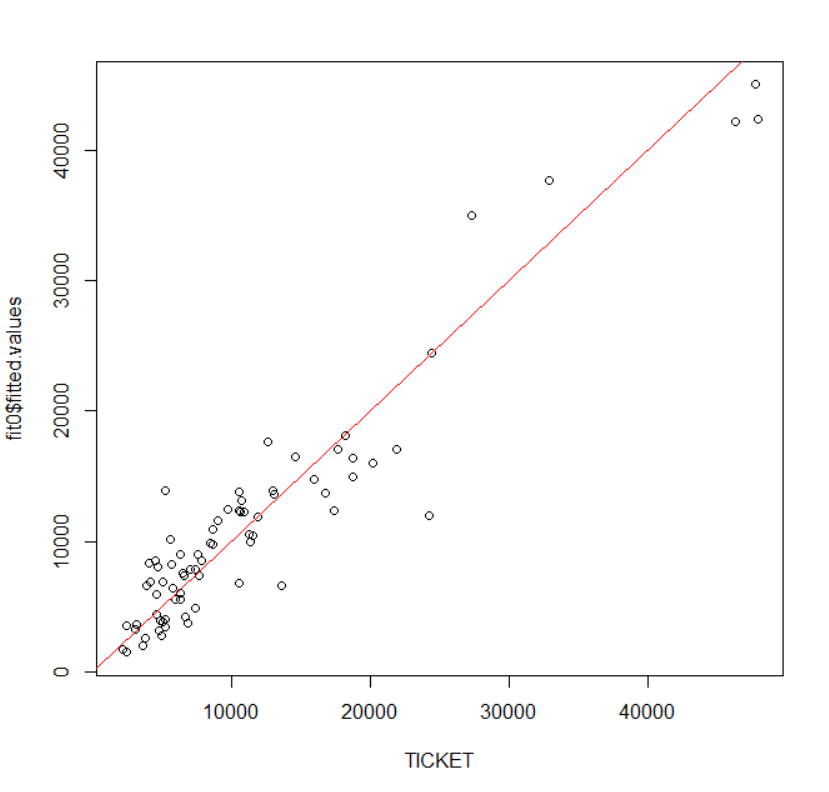
I’m sure not all errors are that easily solvable with a good night of sleep, but I got lucky. I think this applies to lots of areas of life; if you leave things to ruminate a bit, you might just find a better answer. Or in my case, a line!

Always more to learn

I spoke to Jack about this assignment a little, and explained what it was I was asked to do. Until our conversation, it did not occur to me that there had been a lot of work on the front-end to get the data for our project ready to go.

For example, here’s a screenshot of a small portion of the data our professor provided:

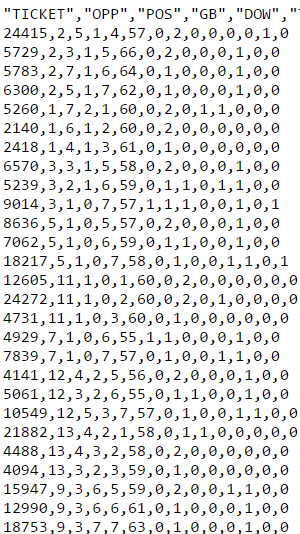
(etc. etc. etc. etc.)

How did this data get here? When I was completing the assignment, I honestly didn’t care, and didn’t even think to care. I just felt incredibly smart for “mastering” R and successfully completing the assignment and making the beautiful plot I posted above. I was thinking to myself that I probably should have skipped this class and put myself directly into the more advanced Regressions class.

I came to my senses. Upon further reflection, it sure seems like compiling all this information is a heck of a lot harder than actually analyzing it! Jack then explained to me that all those articles I proofread for him about scraping data are doing exactly that. And those articles go so far over my head that hearing that brought be back to Earth about my only adequate capabilities.

There’s actually a term for this (credit to Jack for introducing me to it.) It’s called the Dunning-Kruger effect, which Wikipedia summarizes as when “persons of low ability suffer from illusory superiority when they mistakenly assess their cognitive ability as greater than it is.”

Well here I am, a person of “low ability” who has seen the light. I know that I don’t know what I don’t know. I used to know nothing about programming, but I have now progressed to knowing next to nothing about programming. At the very least, Jack’s articles now make more sense to me!

Web Scraping with Python — Part Two — Library overview of requests, urllib2, BeautifulSoup, lxml, Scrapy, and more!

Welcome to part 2 of the Big-Ish Data general web scraping writeups! I wrote the first one a little bit ago, got some good feedback, and figured I should take some time to go through some of the many Python libraries that you can use for scraping, talk about them a little, and then give suggestions on how to use them.

If you want to check the code I used and not just copy and paste from the sections below, I pushed the code to github in my bigishdata repo. In that folder you’ll find a requirements.txt file with all the libraries you need to pip install, and I highly suggest using a virtualenv to install them. Gotta keep it all contained and easier to deploy if that’s the type of project you’re working on. On this front, also let me know if you’re running this and have any issues!

Overall, the goal of the scraping project in this post is to grab all the information – text, headings, code segments and image urls – from the first post on this subject. We want to get the headings (both h1 and h3), paragraphs, and code sections and print them into local files, one for each tag. This task is very simple overall which means it doesn’t require super advanced parts of the libraries. Some scraping tasks require authentication, remote JSON data loading, or scheduling the scraping tasks. I might write an article about other scraping projects that require this type of knowledge, but it does not apply here. The goal here is to show basics of all the libraries as an introduction.

In this article, there’ll be three sections. First, I’ll talk about libraries that execute http requests to obtain HTML. Second, I’ll talk about libraries that are great for parsing HTML to allow you to scrape the data. Third, I’ll write about libraries that perform both actions at once. And if you have more suggestions of libraries to show, let me know on twitter and I’ll throw them in here.

Finally, a couple notes:

Note 1: There are many different ways of web scraping. People like using different methods, different libraries, different code structures, etc. I understand that.  I recognize that there are other useful methods out there – this is what I’ve found to be successful over time.

Note 2: I’m not here to tell you that it’s legal to scrape every website. There are laws about what data is copyrighted, what data that is owned by the company, and whether or not public data is actually legal to scrape. You might have to check things like robots.txt, their Terms of Service, maybe a frequently asked questions page.

Note 3: If you’re looking for data, or any other data engineering task, get in contact and we’ll see what I can do!

Ok! That all being said, it’s time to get going!

Requesting the Page

The first section here is showing a few libraries that can hit web servers and ask nicely for the HTML.

For all the examples here, I request the page, and then save the HTML in a local file. The other note on this section is that if you’re going to use one of these libraries, this is part one of the scraping! I talked about that a lot in the first post of this series, how you need to make sure you split up getting the HTML, and then work on scraping the data from the HTML.

First library on the first section is the famous, popular, and very simple to use library, requests.

requests

Let’s see it in action.

import requests
url = "https://bigishdata.com/2017/05/11/general-tips-for-web-scraping-with-python/" 
params = {"limit": 48, 'p': 2} #used for query string (?) values
headers = {'user-agent' : 'Jack Schultz, bigishdata.com, contact@bigishdata.com'}
page = requests.get(url, headers=headers)
helpers.write_html('requests', page.text.encode('UTF-8'))

Like I said, incredibly simple.

Requests also has the ability to use the more advanced features like SSL, credentials, https, cookies, and more. Like I said, I’m not going to go into those features (but maybe later). Time for simple examples for an actual project.

Overall, even before talking about the other libraries below, requests is the way to go.

urllib / urllib2

Ok, time to ignore that last sentence in the requests section, and move on to another simple library, urllib2. If you’re using Python 2.X, then it’s very simple to request a single page. And by simple, I mean couple lines.

Continue reading

Product Mentions Update — Thoughts When Reviewing the Reddit Mentions

More than a few months ago, I created a Python script and a Rails website that tracks links to Amazon that people put in their comments and posts on Reddit. Clearly, a great name for this type of site is Product Mentions. Now that it’s been a while where the site is gathering the mentions, figure it’s time enough to look through the mentions and talk about interesting thoughts!

And before we get started, if you’re looking for information about Reddit comments on your site, blog, company, etc., shoot me an email and we can get started.

Technology!

Obviously the first thing to check is what Amazon product groups are the most mentioned on Reddit, and when you check the page, it’s incredibly clear that people love mentioning specific computer technology. Check out the frequency of product mentions of personal computers. Laptops on laptops, and apparently so many mentions of Acer brand laptops.

Books!

Since books are the second most mentioned product, it is also very interesting to see what type of subreddit’s are the ones to link books. And there are tons of them, but they’re much more specific subreddits.

Continue reading

Popular song lyrics have become more negative over time

This post is guest-written by Alex Lacey, a student at The Ohio State University. It was inspired by the ideas (and used some of the code) from this previous Big-Ish data post.

Popular music is constantly evolving, and the changes it has undergone over the last few decades are quite significant. In this project, I have investigated the changes in sentiment (the positivity/negativity) of popular music lyrics since the 1950s. I wanted to know: has the sentiment of song lyrics evolved along with other musical changes?

For this sentiment analysis, I used four open-source lexicons: AFINN, NRC, Bing, and Syuzhet, all of which were developed by separate research teams. There lexicons, which each comprise of a large set of words and their corresponding human-rated sentiment scores (the positivity/negativity of each word) are all available in the R syuzhet package. Each method works in the same way: a full block of text (which, in this case, represents all of the lyrics of a given song) is separated into individual words based on spacing and punctuation. Each word is examined for its presence in the lexicon; if it is present, then that word is assigned its corresponding score in the lexicon, but if it is not present, the word is not assigned a score. After that, all of the available word-scores in a block of text are averaged to produce a sentiment score for the full block of text.

But what data is necessary to answer this question? What exactly defines the “popularity” of music? This is a subjective concept, so I used two separate (albeit somewhat overlapping) definitions as a proxy for popularity: best-selling songs and best-selling artists.

Best-Selling Songs

For data about the most popular songs, I used a dataset containing the 100 top-selling songs of each year from 1956 to 2015. That dataset was created by Kaylin Walker, a Statistics Masters Student at Concordia College, and it can be downloaded here.
I analyzed every song in the dataset – 5100 total – with all four Sentiment Analysis methods discussed above. However, comparing the scores of songs for each method was not initially possible: the methods have different scales and some methods might rate songs more positively or negatively than others in general. To solve this problem, the sentiment values for each method were converted to z-scores, meaning that the full set of song-scores were centered (so that the mean sentiment score equals 0) and then scaled (so that the standard deviation equals 1). This allows for the four lexicons to be compared against each other accurately. As an representative example, here are the results from the AFINN lexicon, with a simple regression line:

afinn_top_100

There is a statistically significant downward trend here, and interestingly, it seems to be caused not by the majority of songs, but by a minority of songs in recent decades that are highly negative. There is a great increase in the variance in the sentiment of popular songs, primarily in the downward direction. It is quite interesting that for many years, not one popular song was more than 4 standard deviations below the average, but starting in the 1990’s, this became relatively commonplace.

These same trends are reflected in all four sentiment lexicons (all of them are statistically significant):

multiplot_songs

But perhaps the highly-negative songs in recent years weren’t actually the most popular; of the top 100 for any given year, most people don’t hear the bottom 50 very often, and likely won’t be able to recognize them. I thought that maybe the songs with negative lyrics populate the lower rankings of the Top 100, perhaps greatly enjoyed by a counter-culture but not by most people (in general, genres like punk and metal often fall into this category). Whether or not a devoted cult-following constitutes “popularity” is up for debate, but it would be unfair to make final conclusions about changes in popular music based only on counter-cultures. To test only the hyper-recognizable and undeniably “popular” songs, I decided to do the same analysis on specifically the Top 10 most popular songs from each year, as opposed to the Top 100. The z-scores of the results from the AFINN lexicon are shown in the graph below. I included differential opacity-weighting for the songs as well (the most popular songs are a darker shade).

afinn_top_10

The initial observation holds true; there is still a significant drop in the negativity of the most-negative songs after 1990. This trend was found with all four sentiment analysis methods:

multiplot_songs_top10 

Most Popular Artists

Along with the most-popular songs, I also investigated lyrics from the most-popular artists, using their entire discography. This could augment the prior analysis by providing a clearer picture of everything written by the most influential lyricists, not just their songs on the radio. The list of 100 best-selling artists came from this list on Wikipedia. The specific years, which were assigned by the Wikipedia list, refer to the date in which each artist released their first charted single.To obtain the lyrics of each artist, I scraped Genius.com using Python code by Jack Schultz in this Big-Ish data post, in which he did a very interesting analysis of country music. Here are the AFINN lexicon results, the size of which represent the amount of sales, and the colors of which represent the genre of music:

graph1
Roughly the same trend is observed as the analysis of the most popular songs (and in case you’re interested, the red dot that is six standard deviations below the average is Eminem). Just like before, here are the results for all four methods (note that to accurately portray most of the points, the graphs were all cropped, which resulted in the removal of a couple of artists above 1.75 standard deviations and a handful of artists below 1.75 standard deviations):

multiplot

However, in consideration of these results, it is very important to note that increasingly-negative lyrics is not necessarily a bad thing. In fact, I believe the opposite: this is a demonstration of popular art becoming more interesting, more honest, more meaningful, and a better representation of the human condition. Music has continuously diversified and reinvented itself, and this is reflected in the lyrics too.

In the future, I plan to also investigate the sentiment of these lyrics with IBM’s Watson, specifically the AlchemyLanguage API. This would be particularly useful because it is a non-lexicon-based method (it considers how the words are arranged, not just the words themselves). This can be quite important. For example, lets briefly examine the phrase “I am not happy”, which we should all agree is an overall negative statement. The lexicon-based methods would likely give that phrase a positive sentiment score, because the first three words are relatively neutral, and the last word is quite positive. On the other hand, more advanced methods (such as IBM’s Watson), are able to understand that “not happy” is the opposite of happy, and they would likely classify the phrase correctly. However, even with the lexicon-based methods used in this analysis, I can assume with an acceptable degree of confidence that the results will be the same due to the relatively large amount of data.


Classifying Country Music Songs is an Art — Getting Training Data

If you’ve been following along recently, I’ve been writing about my theory of country music, and how unlike most other genres out there, country music song topics are, let’s just say, much more centralized. And so in my continuing effort to automatically classify the country songs topic, I need to take all the songs lyrics I downloaded, and manually classify them so I have some training data.

This is actually the third post on this topic I’ve written. In the first post where I showed how to get song lyrics using Genius’s API and scraping, and then the second post, where I gathered up all the lyrics from country artists, removed the duplicates, and realized that Lee Brice talks about beer and trucks much more than he does about love. The stats I ran at the end of the second entry are fine and all, but really what I have at the moment is some 5 thousand songs that are uncategorized, which isn’t going to allow me to do any more sophisticated classification than simple word analysis.

What this means is I’m going to need some help classifying those 5000 songs. To do this, I wrote a rails app deployed on Heroku free mode that will allow anyone to sign up and help with this task. Obviously I’m not expecting people to get through all 5000 themselves (other than me of course), but hopefully if I can get enough people to do more than a few songs, I can get a good representation from which I can get interesting results.

Rest of the article is as follows. First, I’ll have a section where I talk about my theory of country music song topics, which I’ve been annoying my friends by talking about whenever we talk about country music. Then in the next / last section, I’ll talk about how I’m looking to get these songs classified, and what the interface is like and what’s going on behind the scenes.

As an aside, I am somewhat of a fan of country music. I usually just say it’s pop music with a slide, and by definition, pop music is catchy. But still, those country song lyrics can get quite ridiculous () which is definitely fun to laugh at.

Also, follow me along on twitter for more updates on this, and other topics.

Country Music Song Topics

Topic 1: Love

Love. The classic song topic — universally relatable, unbounded in subtopics, and somewhat of a default topic for any story, song or otherwise.Now that I think about it, I’m not sure there’s any song genre out there that doesn’t have love as a main song topic. So it makes sense that love is quite prevalent in many of the country songs.

Whether happy songs, about how Brett Young can’t go to sleep unless his girl is next to him at night,

or sad songs, about how the guy in Billy Currington’s song, “It Don’t Hurt Like It Used To”, was broken up with, but got over it eventually. Or somewhat, cause it still hurts.

Now that I think about it, I’m not sure there’s any song genre out there that doesn’t have love as a main song topic.

Topic 2: Small Town Life

Nothing says small town life like boots, dirt roads, dumpy bars with a cover band, railroad tracks, barns, white churches, and crop fields. No, I’m not making this up, those are just some of the things the band LoCash sings about in their recent song titled “I Love this Life”

If that wasn’t enough, how about picket fences, blue sky and green grass, old Ford trucks, back porches, homemade wine, tire swings, fireworks, and dead deer heads waiting to be hung on the wall. Yup, that’s just what Drake White is singing about in his song “Livin’ The Dream”. I admit, if I hear this when scrolling through stations on the radio in my car that doesn’t have an aux port, I’ll turn it up.

Continue reading