U.S. Open Data — Gathering and Understanding the Data from 2018 Shinnecock

After losing in a playoff to make it out of the local qualifying for the 2018 US Open at Shinnecock, I’m stuck at my apartment watching everyone struggle, wondering how much I’d be struggling if I was there myself.

Besides on TV, the US Open website offers some other way to follow what players are doing. As shown here, they very generously give us information on everyone’s shots on different holes. We’re able to see where people hit the ball, on which shot, and what their resulting score was on the hole. For example, why in the world did Tony Finau, the currently second ranked longest hitter on tour, hit it short off the first tee, leave himself 230 yards to the hole where he makes bogey?

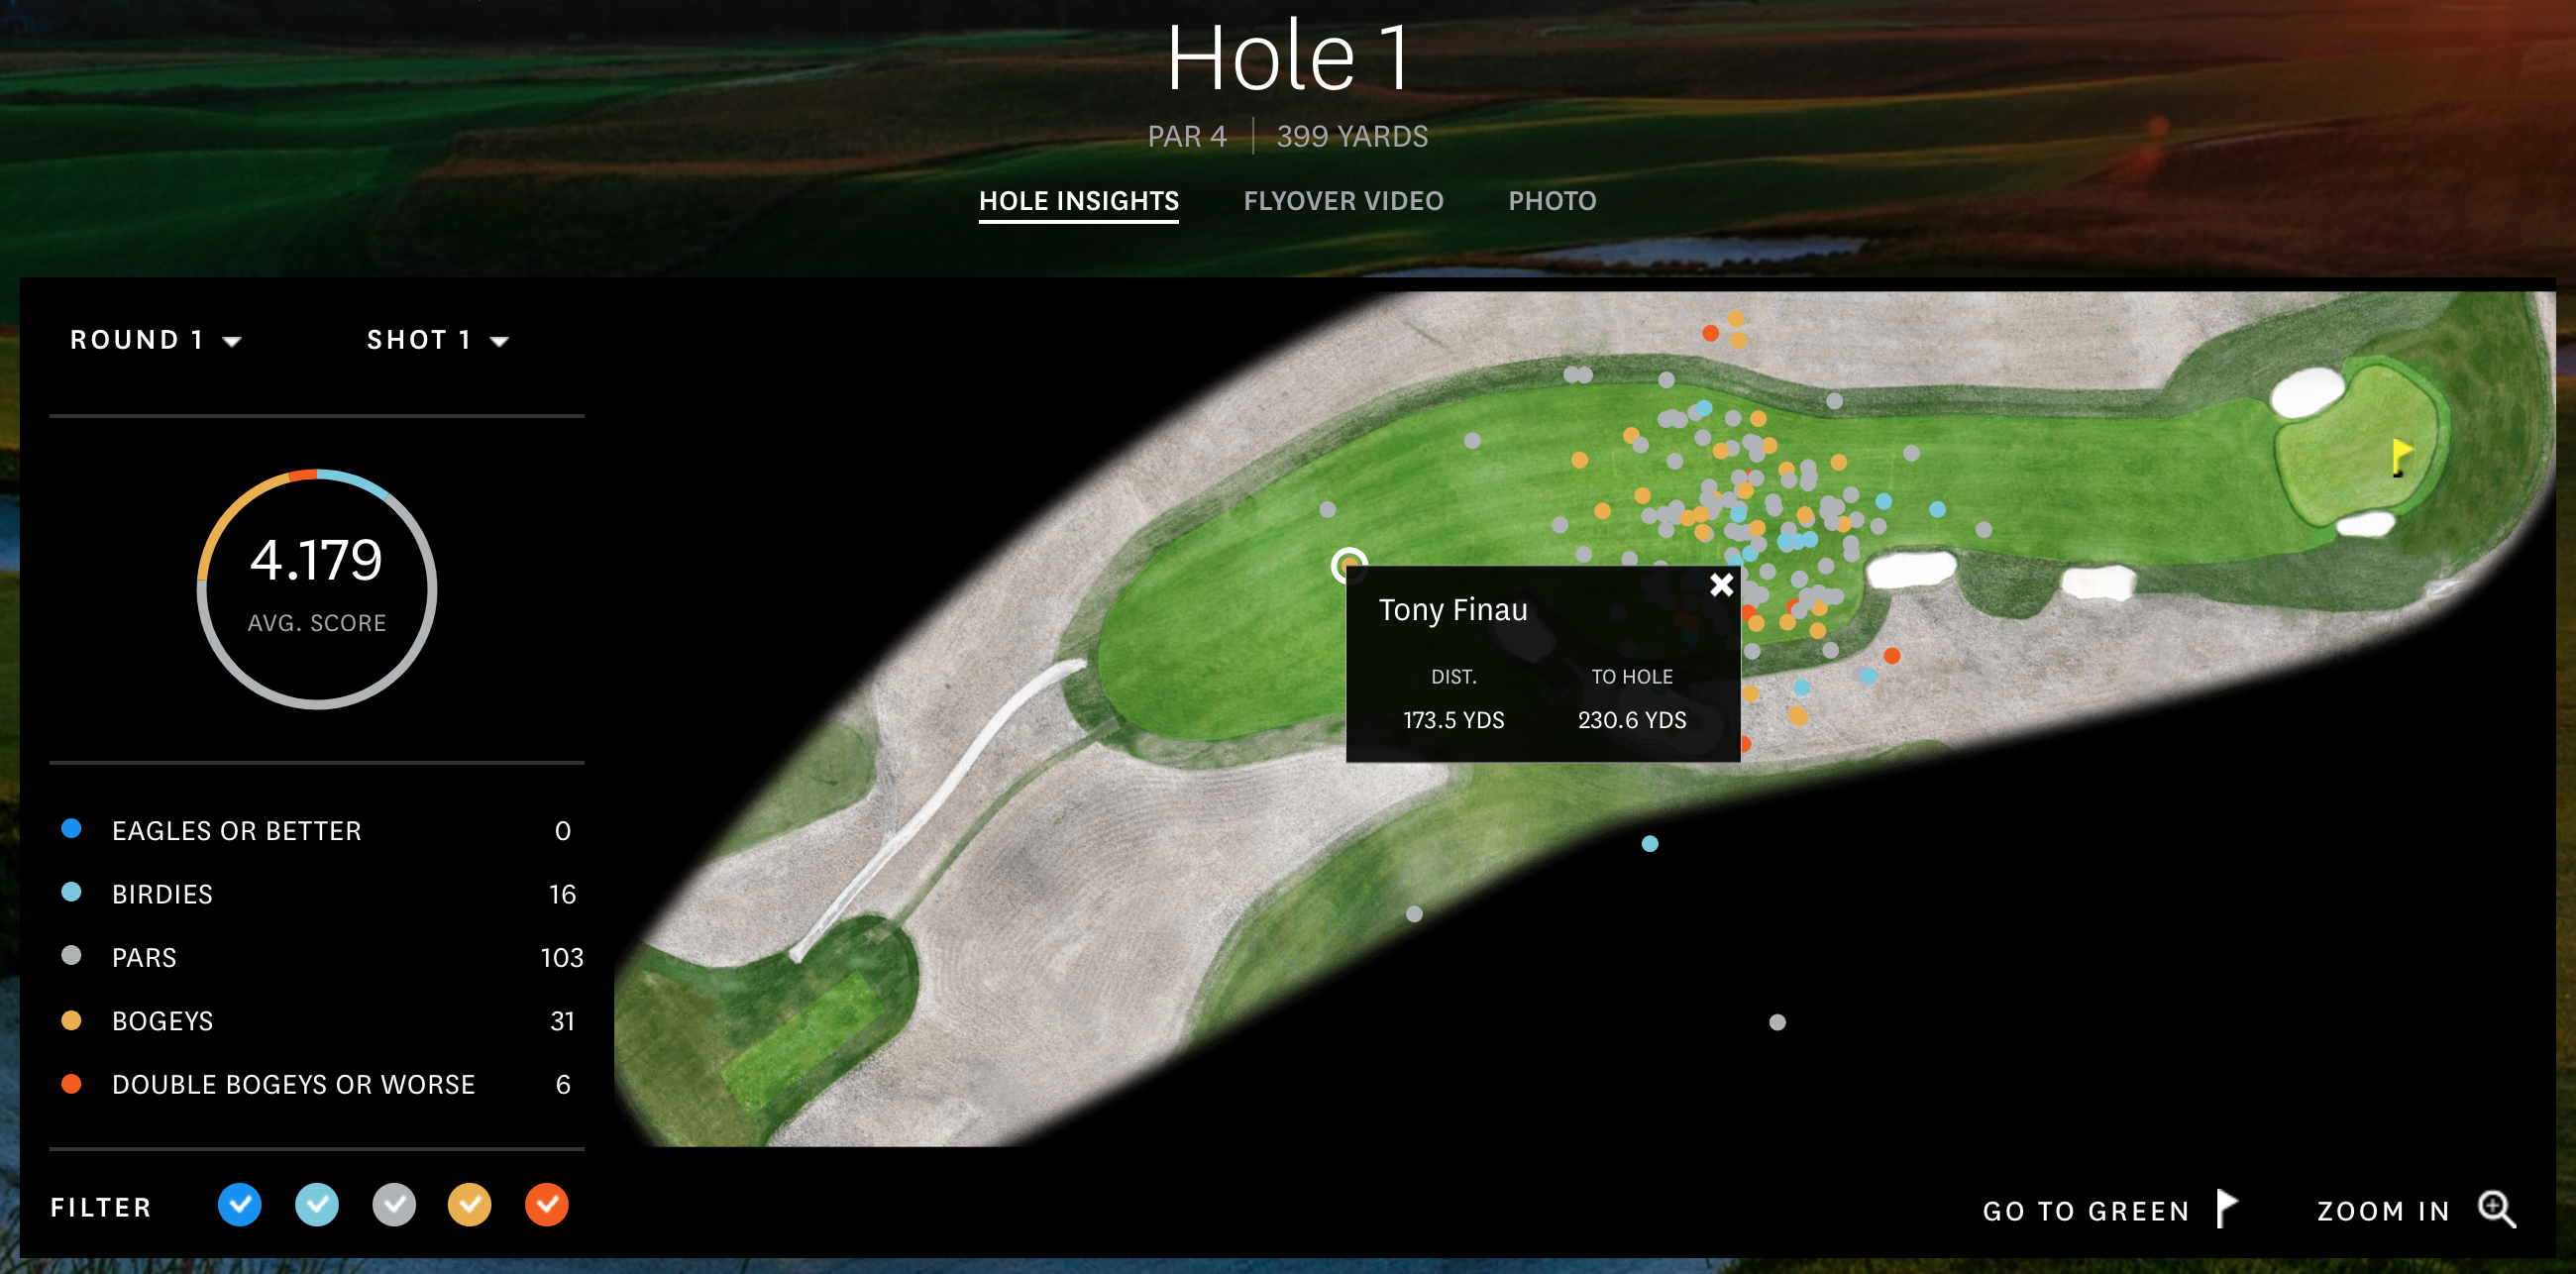
Why didn’t Tony rip D?

One of the cool things these images show is the groupings of all the shots on a hole, like the tee shots here. And when I see very specific and interactive data like we have here, I know it comes from somewhere that I’m able to see myself. So I figured I should grab that data and do some cluster analysis on different holes to see if there are certain spots that players like to hit it.

Here, I’ll go through the data we have, what the values and the numbers mean, and also the code I wrote to eat up the data and display the graphs. Once I have this part going, I’ll be able to perform further analysis to most things that come to mind.

Any questions, comments, concerns, trash talking, get in touch: twitter, contact.

Current Posts

Using Clustering Algorithms to Analyze Golf Shots

Finding the data

First step was to search for where the data for the hole insights page was coming from. As always, open the dev tools, click on the network tab, and find what’s getting called with a pretty name.
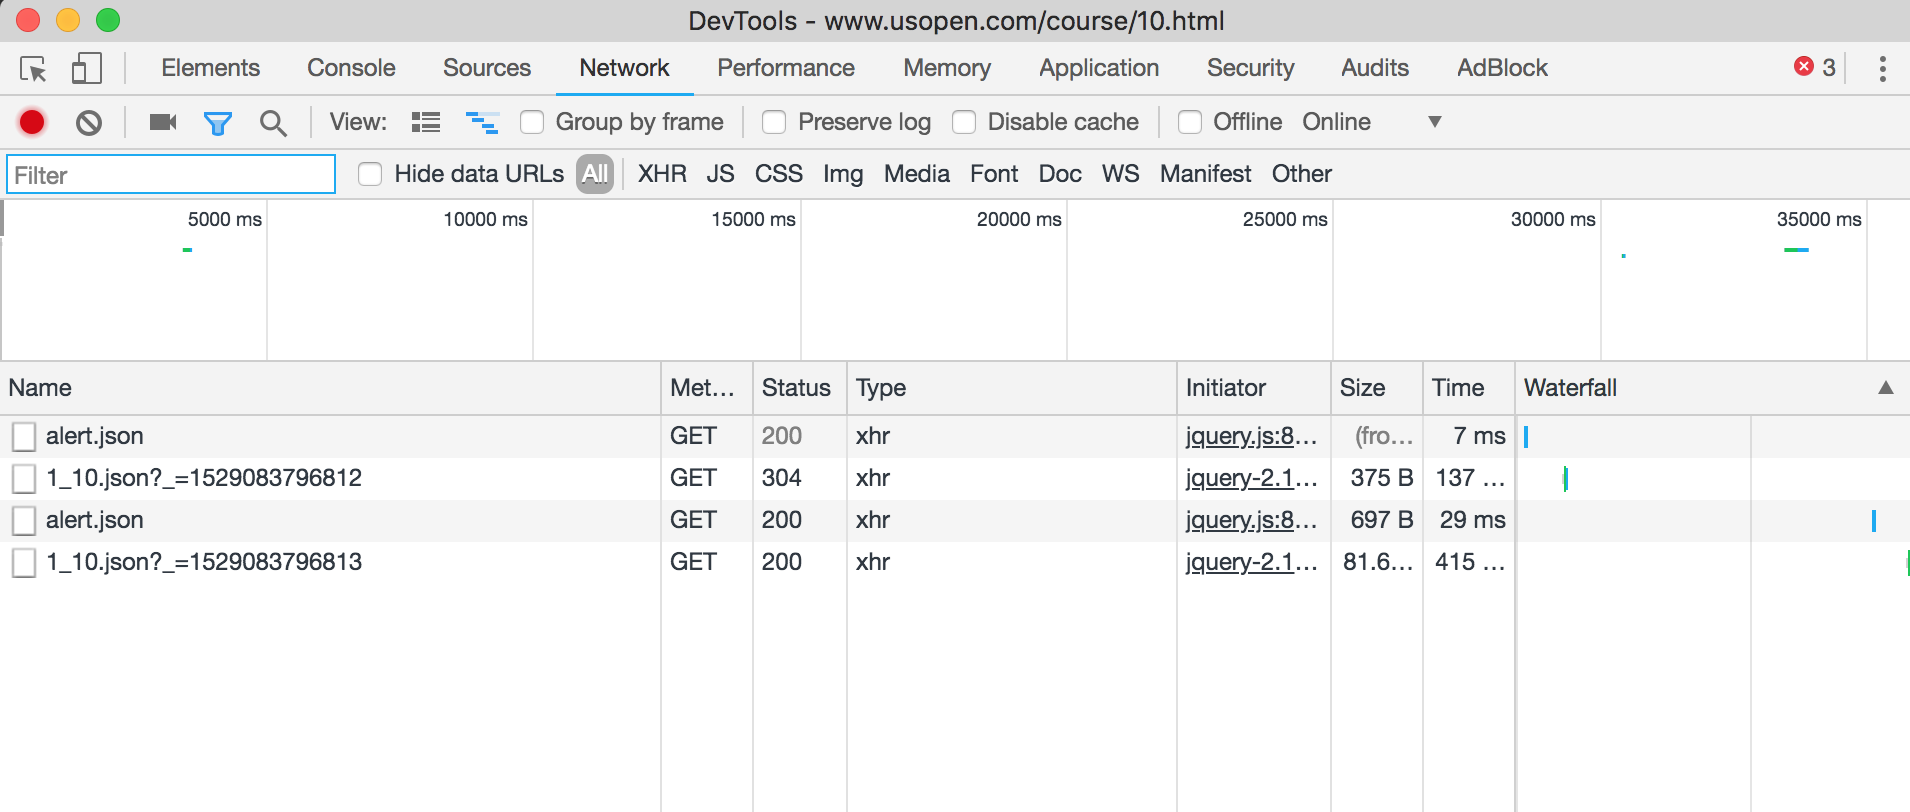
Alert!

The file itself is quite dense and has all the information, which is really cool! It has IDs for all the players, all the shots they have on the hole, which include the starting distance from the flag and the ending distance to the flag.

First off, we’re given a list of Ps, meaning an array of player information, like this:

...
{u'FN': u'Justin', u'ID': u'33448', u'IsA': False, u'LN': u'Thomas', u'Nat': u'USA', u'SN': u'THOMAS'},
{u'FN': u'Dustin', u'ID': u'30925', u'IsA': False, u'LN': u'Johnson', u'Nat': u'USA',u'SN': u'JOHNSON D'}
{u'FN': u'Tiger', u'ID': u'08793', u'IsA': False, u'LN': u'Woods', u'Nat': u'USA', u'SN': u'WOODS'}
...

It looks like we have first name, player’s ID, whether or not they’re an amateur, last name, nationality, scoreboard name. The important part of this information is the ID, where we’ll be able to match players to shots.

Next, we’re given a few stats on the hole for the day:

Continue reading

NBA Data Scraping — Game Data

In sports, as in most endeavors, playing on your home field is an advantage. The crowd, the lines of sight, the mascot (eh, kind of) all contribute to the home field advantage. But how valuable is it to play on your home field? That was the question that inspired me to look into using actual results and data to come up with a number that can quantify the effect of playing at home. First up, NBA.

Note: I’m separating this post into two posts, the first of which is this, the data scraping portion. Code for all this is here, written a while ago and will probably change while I do a little more research on these questions.

There are a ton of different end goals for scraping data from the internet. Maybe it’s to get a csv file with all the information to load into excel. Maybe it’s to put into the database for a webapp (like Rails or Django). Or maybe it’s to run some analysis and generate some visuals to answer a question as is the case here. There are endless languages, libraries, databases, and ORMs that you can use. But the one thing that’s consistent for all web scraping is that you need to figure out how the data is organized on the page, and how it gets there.

First step in all of these is to go to what you think of as the best source for the data, in this case, nba.com. First thing I noticed was that it has a stats specific section and if you click on a specific game to get the stats, you get a nice table of all the player lines and the quarter by quarter results. Even better, the table seems to load after the page, meaning that there’s probably some sort of AJAX call to load the data. Jackpot for scrapers.

Digging with Chrome’s developer tools, I see some requests going out to the site with ids for the game, league, and date. Trying a few values and I’m able to come up with a pattern for their urls. Also interesting that http://stats.nba.com/stats/scoreboard/ let’s you know what you’re missing in order to get the data you’re looking for. Thanks nba.com. I’ll leave the actual pattern they use as an exercise to the reader by either playing around with the code, or looking at the code I provide here.

Next comes parsing the resulting JSON. By use of a chrome extension that formats the JSON, I went through and deciphered the object so I would be able to know where the correct data. In this case, there are bunches of headers and data arrays to figure out, but all the information is there in one query which makes it really nice to deal with. Again, if you want to see what one of these results looks like, I’ll leave it to you to look at. Though I will say using parameters of LeagueID=00, DayOffset=0 and GameDate=01/01/2015 is a decent starting point.

Onto the code part of it. For this demo, I’m using Python (my personal favorite scripting language and the one I started out learning back in the day), with MongoDB, MongoEngine as an ORM, and gevent to help make it quicker.

First off, check out the gist here. To run the code, you’ll need to have gevent, mongoengine, and requests all installed with pip (and preferably using virtualenv). All of that is info for another article and overviews on how to do that are all over the web. If you’re trying to learn scraping, read through the code and try to understand what’s going on before reading on. Much better to learn that way I think.

Couple notes on the implementation. First is the number of gevent workers you have. I have 10 going in the code, but that value can increase probably. Scraping is all about being respectful to the site you’re getting the data from. You absolutely do not want to overwhelm their servers with requests which can easily happen with concurrent workers. Something like nba.com is expected to get a lot of traffic, and the fact that it’s rendering json instead of on actual html page make it possible to have a few more workers at once. But don’t overdo it.

Another thing to note is handling of cases that shouldn’t happen. In this case there are two cases where a random event could cause data oddities — ones that should never happen. To deal with those, I like to put big logger warnings in, so I’m able to search after running the code to see if one of those cases happened.

Finally, I make sure to put the data in a database. For data this small, and really for any amount of data you can scrape, any type of database works (With all the talk about “Big Data”, it’s important to think about how big the data has to be to qualify to be called that.) Again, we don’t want to overload the NBA’s servers and by storing the data, we only have to run the scraping once to get the data. If you don’t want to use a database, putting the data in a csv file with each row having the game data is also a valid storage method. You’d still only need to run the scraping once and then you can play with the data all you want.

And that’s it for the scraping. In the end, it wasn’t so much scraping as it was hitting an api for the data, but it’s all the same in the end once you’ve stored it all. Look for some analysis soon!

Twitter: @jack_schultz